

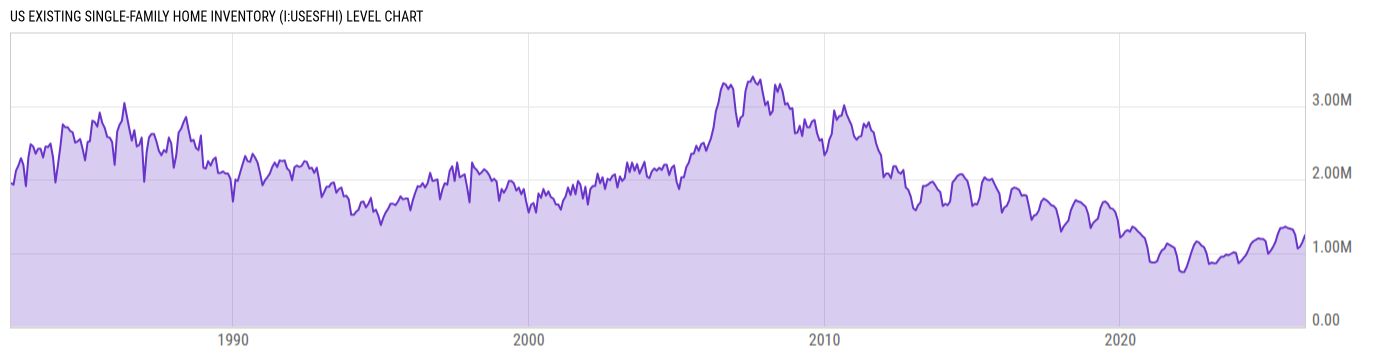
US Existing Single-Family Home Inventory (I:USESFHI)
1.33M for Apr 2026
Level Chart
Basic Info
|
US Existing Single-Family Home Inventory is at a current level of 1.33M, up from 1.20M last month and up from 1.26M one year ago. This is a change of 10.83% from last month and 5.56% from one year ago. |
| Report | Existing-Home Sales |
| Category | House Sales |
| Region | United States |
| Source | National Association of Realtors |
Stats
| Last Value | 1.33M |
| Latest Period | Apr 2026 |
| Last Updated | May 14 2026, 12:10 EDT |
| Next Release | Jun 9 2026, 10:00 EDT |
| Average Growth Rate | 1.53% |
| Value from Last Month | 1.20M |
| Change from Last Month | 10.83% |
| Value from 1 Year Ago | 1.26M |
| Change from 1 Year Ago | 5.56% |
| Frequency | Monthly |
| Adjustment | Not Seasonally Adjusted |
| Download Source File |
Historical Data
| Date | Value |
|---|---|
| April 30, 2026 | 1.33M |
| March 31, 2026 | 1.20M |
| February 28, 2026 | 1.15M |
| January 31, 2026 | 1.09M |
| December 31, 2025 | 1.06M |
| November 30, 2025 | 1.25M |
| October 31, 2025 | 1.32M |
| September 30, 2025 | 1.33M |
| August 31, 2025 | 1.34M |
| July 31, 2025 | 1.36M |
| June 30, 2025 | 1.34M |
| May 31, 2025 | 1.34M |
| April 30, 2025 | 1.26M |
| March 31, 2025 | 1.15M |
| February 28, 2025 | 1.08M |
| January 31, 2025 | 1.03M |
| December 31, 2024 | 990000.0 |
| November 30, 2024 | 1.16M |
| October 31, 2024 | 1.19M |
| September 30, 2024 | 1.19M |
| August 31, 2024 | 1.20M |
| July 31, 2024 | 1.18M |
| June 30, 2024 | 1.16M |
| May 31, 2024 | 1.12M |
| April 30, 2024 | 1.04M |
| Date | Value |
|---|---|
| March 31, 2024 | 970000.0 |
| February 29, 2024 | 930000.0 |
| January 31, 2024 | 890000.0 |
| December 31, 2023 | 860000.0 |
| November 30, 2023 | 1.00M |
| October 31, 2023 | 1.01M |
| September 30, 2023 | 990000.0 |
| August 31, 2023 | 970000.0 |
| July 31, 2023 | 980000.0 |
| June 30, 2023 | 950000.0 |
| May 31, 2023 | 950000.0 |
| April 30, 2023 | 910000.0 |
| March 31, 2023 | 860000.0 |
| February 28, 2023 | 860000.0 |
| January 31, 2023 | 870000.0 |
| December 31, 2022 | 850000.0 |
| November 30, 2022 | 1.00M |
| October 31, 2022 | 1.08M |
| September 30, 2022 | 1.10M |
| August 31, 2022 | 1.14M |
| July 31, 2022 | 1.16M |
| June 30, 2022 | 1.11M |
| May 31, 2022 | 1.02M |
| April 30, 2022 | 910000.0 |
| March 31, 2022 | 810000.0 |
News
Headline
Time (ET)
Basic Info
|
US Existing Single-Family Home Inventory is at a current level of 1.33M, up from 1.20M last month and up from 1.26M one year ago. This is a change of 10.83% from last month and 5.56% from one year ago. |
| Report | Existing-Home Sales |
| Category | House Sales |
| Region | United States |
| Source | National Association of Realtors |
Stats
| Last Value | 1.33M |
| Latest Period | Apr 2026 |
| Last Updated | May 14 2026, 12:10 EDT |
| Next Release | Jun 9 2026, 10:00 EDT |
| Average Growth Rate | 1.53% |
| Value from Last Month | 1.20M |
| Change from Last Month | 10.83% |
| Value from 1 Year Ago | 1.26M |
| Change from 1 Year Ago | 5.56% |
| Frequency | Monthly |
| Adjustment | Not Seasonally Adjusted |
| Download Source File |