

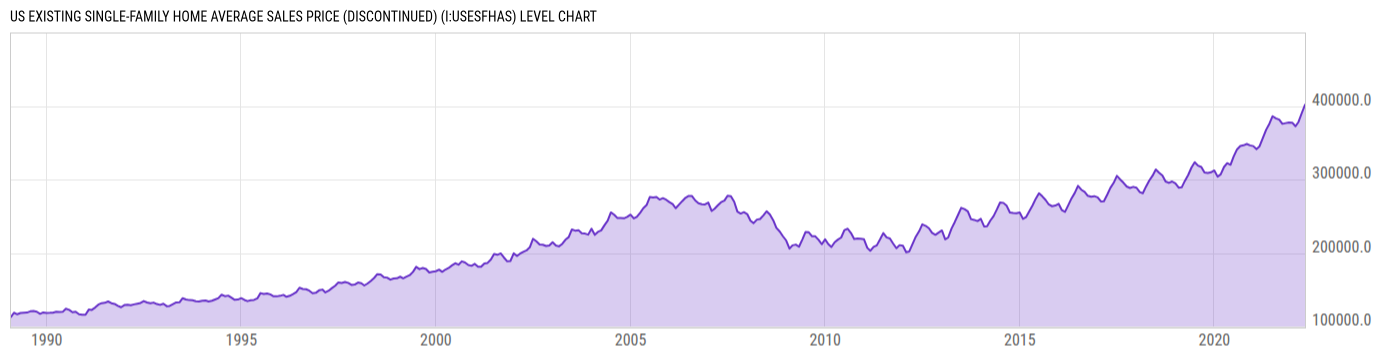
US Existing Single-Family Home Average Sales Price (DISCONTINUED) (I:USESFHAS)
401600.0 for Apr 2022
Level Chart
Basic Info
|
US Existing Single-Family Home Average Sales Price is at a current level of 401600.0, up from 390500.0 last month and up from 367500.0 one year ago. This is a change of 2.84% from last month and 9.28% from one year ago. |
| Report | Existing-Home Sales |
| Category | House Sales |
| Region | United States |
| Source | National Association of Realtors |
Stats
| Last Value | 401600.0 |
| Latest Period | Apr 2022 |
| Last Updated | May 19 2022, 10:07 EDT |
| Next Release | Aug 22 2023, 11:00 EDT |
| Average Growth Rate | 4.09% |
| Value from Last Month | 390500.0 |
| Change from Last Month | 2.84% |
| Value from 1 Year Ago | 367500.0 |
| Change from 1 Year Ago | 9.28% |
| Frequency | Monthly |
| Adjustment | Not Seasonally Adjusted |
| Download Source File |
Historical Data
| Date | Value |
|---|---|
| April 30, 2022 | 401600.0 |
| March 31, 2022 | 390500.0 |
| February 28, 2022 | 378300.0 |
| January 31, 2022 | 372400.0 |
| December 31, 2021 | 377300.0 |
| November 30, 2021 | 377600.0 |
| October 31, 2021 | 376700.0 |
| September 30, 2021 | 375700.0 |
| August 31, 2021 | 381400.0 |
| July 31, 2021 | 383200.0 |
| June 30, 2021 | 386100.0 |
| May 31, 2021 | 375900.0 |
| April 30, 2021 | 367500.0 |
| March 31, 2021 | 356500.0 |
| February 28, 2021 | 345300.0 |
| January 31, 2021 | 341300.0 |
| December 31, 2020 | 345400.0 |
| November 30, 2020 | 346400.0 |
| October 31, 2020 | 348300.0 |
| September 30, 2020 | 346500.0 |
| August 31, 2020 | 345500.0 |
| July 31, 2020 | 340900.0 |
| June 30, 2020 | 331400.0 |
| May 31, 2020 | 320000.0 |
| April 30, 2020 | 322200.0 |
| Date | Value |
|---|---|
| March 31, 2020 | 317000.0 |
| February 29, 2020 | 307000.0 |
| January 31, 2020 | 303900.0 |
| December 31, 2019 | 312300.0 |
| November 30, 2019 | 309800.0 |
| October 31, 2019 | 308900.0 |
| September 30, 2019 | 309400.0 |
| August 31, 2019 | 317000.0 |
| July 31, 2019 | 318800.0 |
| June 30, 2019 | 323500.0 |
| May 31, 2019 | 316300.0 |
| April 30, 2019 | 306100.0 |
| March 31, 2019 | 298400.0 |
| February 28, 2019 | 289300.0 |
| January 31, 2019 | 288900.0 |
| December 31, 2018 | 294600.0 |
| November 30, 2018 | 297300.0 |
| October 31, 2018 | 295300.0 |
| September 30, 2018 | 297300.0 |
| August 31, 2018 | 305500.0 |
| July 31, 2018 | 309200.0 |
| June 30, 2018 | 313600.0 |
| May 31, 2018 | 305200.0 |
| April 30, 2018 | 298700.0 |
| March 31, 2018 | 290600.0 |
News
Headline
Time (ET)
07/16 12:53
07/03 11:11
06/30 12:33
Basic Info
|
US Existing Single-Family Home Average Sales Price is at a current level of 401600.0, up from 390500.0 last month and up from 367500.0 one year ago. This is a change of 2.84% from last month and 9.28% from one year ago. |
| Report | Existing-Home Sales |
| Category | House Sales |
| Region | United States |
| Source | National Association of Realtors |
Stats
| Last Value | 401600.0 |
| Latest Period | Apr 2022 |
| Last Updated | May 19 2022, 10:07 EDT |
| Next Release | Aug 22 2023, 11:00 EDT |
| Average Growth Rate | 4.09% |
| Value from Last Month | 390500.0 |
| Change from Last Month | 2.84% |
| Value from 1 Year Ago | 367500.0 |
| Change from 1 Year Ago | 9.28% |
| Frequency | Monthly |
| Adjustment | Not Seasonally Adjusted |
| Download Source File |