

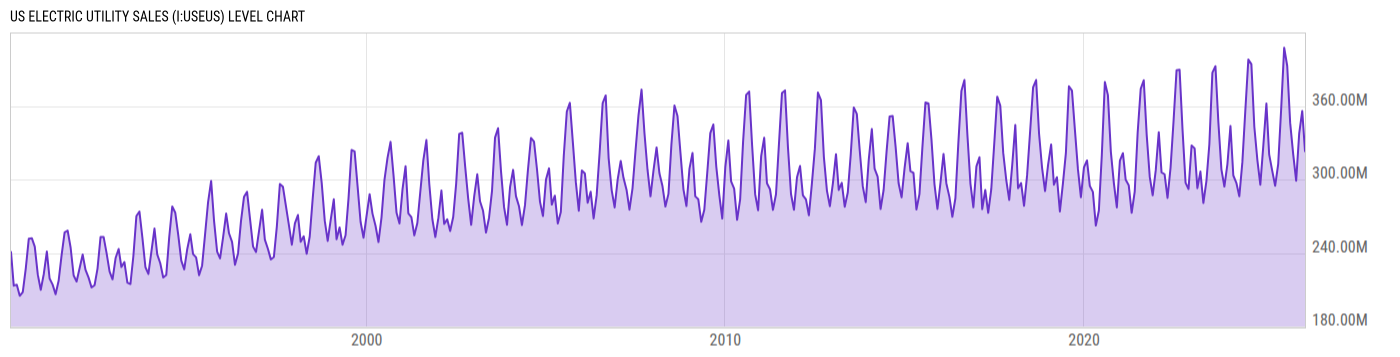
US Electric Utility Sales (I:USEUS)
323.03M MWh for Feb 2026
Level Chart
Basic Info
|
US Electric Utility Sales is at a current level of 323.03M, down from 355.94M last month and up from 320.56M one year ago. This is a change of -9.24% from last month and 0.77% from one year ago. |
| Report | Monthly Electric Utility Sales and Revenue |
| Category | Energy |
| Region | United States |
| Source | Energy Information Administration |
Stats
| Last Value | 323.03M |
| Latest Period | Feb 2026 |
| Last Updated | Apr 30 2026, 10:37 EDT |
| Next Release | May 30 2026, 10:00 EDT (E) |
| Average Growth Rate | 4.80% |
| Value from Last Month | 355.94M |
| Change from Last Month | -9.24% |
| Value from 1 Year Ago | 320.56M |
| Change from 1 Year Ago | 0.77% |
| Frequency | Monthly |
| Unit | Megawatt Hours |
| Adjustment | N/A |
| Download Source File |
Historical Data
| Date | Value |
|---|---|
| February 28, 2026 | 323.03M |
| January 31, 2026 | 355.94M |
| December 31, 2025 | 337.72M |
| November 30, 2025 | 299.02M |
| October 31, 2025 | 320.59M |
| September 30, 2025 | 346.20M |
| August 31, 2025 | 392.63M |
| July 31, 2025 | 407.63M |
| June 30, 2025 | 357.10M |
| May 31, 2025 | 312.49M |
| April 30, 2025 | 294.85M |
| March 31, 2025 | 307.24M |
| February 28, 2025 | 320.56M |
| January 31, 2025 | 361.98M |
| December 31, 2024 | 328.19M |
| November 30, 2024 | 295.80M |
| October 31, 2024 | 315.90M |
| September 30, 2024 | 343.07M |
| August 31, 2024 | 394.20M |
| July 31, 2024 | 397.87M |
| June 30, 2024 | 355.88M |
| May 31, 2024 | 313.96M |
| April 30, 2024 | 286.26M |
| March 31, 2024 | 297.28M |
| February 29, 2024 | 303.26M |
| Date | Value |
|---|---|
| January 31, 2024 | 343.72M |
| December 31, 2023 | 312.64M |
| November 30, 2023 | 294.25M |
| October 31, 2023 | 308.07M |
| September 30, 2023 | 346.48M |
| August 31, 2023 | 392.44M |
| July 31, 2023 | 387.26M |
| June 30, 2023 | 328.80M |
| May 31, 2023 | 298.71M |
| April 30, 2023 | 280.81M |
| March 31, 2023 | 306.45M |
| February 28, 2023 | 292.95M |
| January 31, 2023 | 325.41M |
| December 31, 2022 | 327.78M |
| November 30, 2022 | 292.26M |
| October 31, 2022 | 297.20M |
| September 30, 2022 | 340.54M |
| August 31, 2022 | 389.63M |
| July 31, 2022 | 389.21M |
| June 30, 2022 | 347.11M |
| May 31, 2022 | 309.70M |
| April 30, 2022 | 284.93M |
| March 31, 2022 | 304.30M |
| February 28, 2022 | 305.86M |
| January 31, 2022 | 338.66M |
News
Headline
Time (ET)
05/22 08:46
05/06 17:25
04/30 15:40
04/29 10:20
Basic Info
|
US Electric Utility Sales is at a current level of 323.03M, down from 355.94M last month and up from 320.56M one year ago. This is a change of -9.24% from last month and 0.77% from one year ago. |
| Report | Monthly Electric Utility Sales and Revenue |
| Category | Energy |
| Region | United States |
| Source | Energy Information Administration |
Stats
| Last Value | 323.03M |
| Latest Period | Feb 2026 |
| Last Updated | Apr 30 2026, 10:37 EDT |
| Next Release | May 30 2026, 10:00 EDT (E) |
| Average Growth Rate | 4.80% |
| Value from Last Month | 355.94M |
| Change from Last Month | -9.24% |
| Value from 1 Year Ago | 320.56M |
| Change from 1 Year Ago | 0.77% |
| Frequency | Monthly |
| Unit | Megawatt Hours |
| Adjustment | N/A |
| Download Source File |