

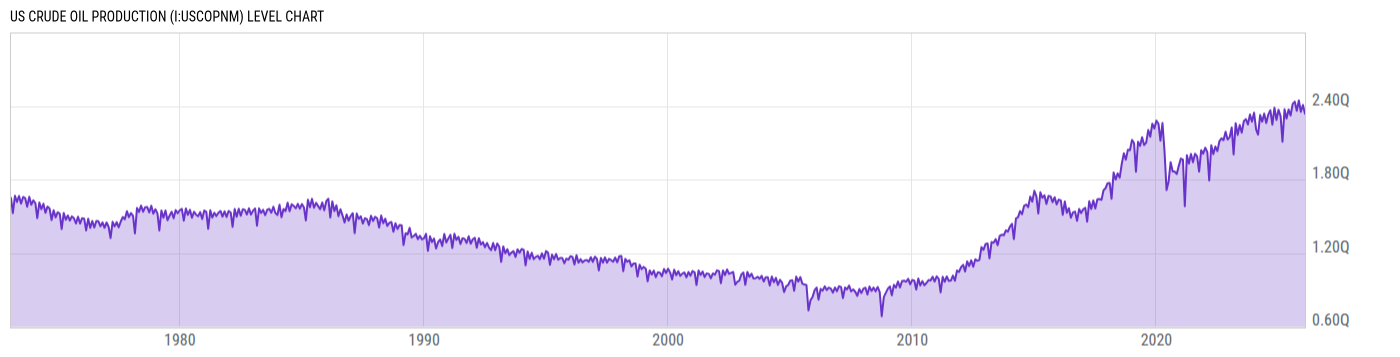
US Crude Oil Production (I:USCOPNM)
2.336Q Btu for Jan 2026
Level Chart
Basic Info
|
US Crude Oil Production is at a current level of 2.336Q, down from 2.408Q last month and up from 2.317Q one year ago. This is a change of -3.00% from last month and 0.81% from one year ago. |
| Report | Monthly Energy Review |
| Category | Energy |
| Region | United States |
| Source | Energy Information Administration |
Stats
| Last Value | 2.336Q |
| Latest Period | Jan 2026 |
| Last Updated | Apr 27 2026, 18:15 EDT |
| Next Release | May 26 2026, 14:00 EDT |
| Average Growth Rate | 2.39% |
| Value from Last Month | 2.408Q |
| Change from Last Month | -3.00% |
| Value from 1 Year Ago | 2.317Q |
| Change from 1 Year Ago | 0.81% |
| Frequency | Monthly |
| Unit | British thermal units |
| Adjustment | N/A |
| Download Source File |
Historical Data
| Date | Value |
|---|---|
| January 31, 2026 | 2.336Q |
| December 31, 2025 | 2.408Q |
| November 30, 2025 | 2.353Q |
| October 31, 2025 | 2.445Q |
| September 30, 2025 | 2.360Q |
| August 31, 2025 | 2.436Q |
| July 31, 2025 | 2.417Q |
| June 30, 2025 | 2.323Q |
| May 31, 2025 | 2.371Q |
| April 30, 2025 | 2.298Q |
| March 31, 2025 | 2.372Q |
| February 28, 2025 | 2.109Q |
| January 31, 2025 | 2.317Q |
| December 31, 2024 | 2.370Q |
| November 30, 2024 | 2.286Q |
| October 31, 2024 | 2.386Q |
| September 30, 2024 | 2.248Q |
| August 31, 2024 | 2.365Q |
| July 31, 2024 | 2.330Q |
| June 30, 2024 | 2.262Q |
| May 31, 2024 | 2.338Q |
| April 30, 2024 | 2.272Q |
| March 31, 2024 | 2.326Q |
| February 29, 2024 | 2.166Q |
| January 31, 2024 | 2.208Q |
| Date | Value |
|---|---|
| December 31, 2023 | 2.345Q |
| November 30, 2023 | 2.273Q |
| October 31, 2023 | 2.330Q |
| September 30, 2023 | 2.249Q |
| August 31, 2023 | 2.292Q |
| July 31, 2023 | 2.277Q |
| June 30, 2023 | 2.182Q |
| May 31, 2023 | 2.245Q |
| April 30, 2023 | 2.164Q |
| March 31, 2023 | 2.260Q |
| February 28, 2023 | 2.006Q |
| January 31, 2023 | 2.224Q |
| December 31, 2022 | 2.145Q |
| November 30, 2022 | 2.126Q |
| October 31, 2022 | 2.190Q |
| September 30, 2022 | 2.121Q |
| August 31, 2022 | 2.136Q |
| July 31, 2022 | 2.113Q |
| June 30, 2022 | 2.031Q |
| May 31, 2022 | 2.069Q |
| April 30, 2022 | 2.007Q |
| March 31, 2022 | 2.080Q |
| February 28, 2022 | 1.792Q |
| January 31, 2022 | 2.023Q |
| December 31, 2021 | 2.060Q |
News
Headline
Time (ET)
05/22 15:56
05/12 15:59
Basic Info
|
US Crude Oil Production is at a current level of 2.336Q, down from 2.408Q last month and up from 2.317Q one year ago. This is a change of -3.00% from last month and 0.81% from one year ago. |
| Report | Monthly Energy Review |
| Category | Energy |
| Region | United States |
| Source | Energy Information Administration |
Stats
| Last Value | 2.336Q |
| Latest Period | Jan 2026 |
| Last Updated | Apr 27 2026, 18:15 EDT |
| Next Release | May 26 2026, 14:00 EDT |
| Average Growth Rate | 2.39% |
| Value from Last Month | 2.408Q |
| Change from Last Month | -3.00% |
| Value from 1 Year Ago | 2.317Q |
| Change from 1 Year Ago | 0.81% |
| Frequency | Monthly |
| Unit | British thermal units |
| Adjustment | N/A |
| Download Source File |