

US Crude Oil Imports (I:USCOI)
1.096Q Btu for Feb 2026
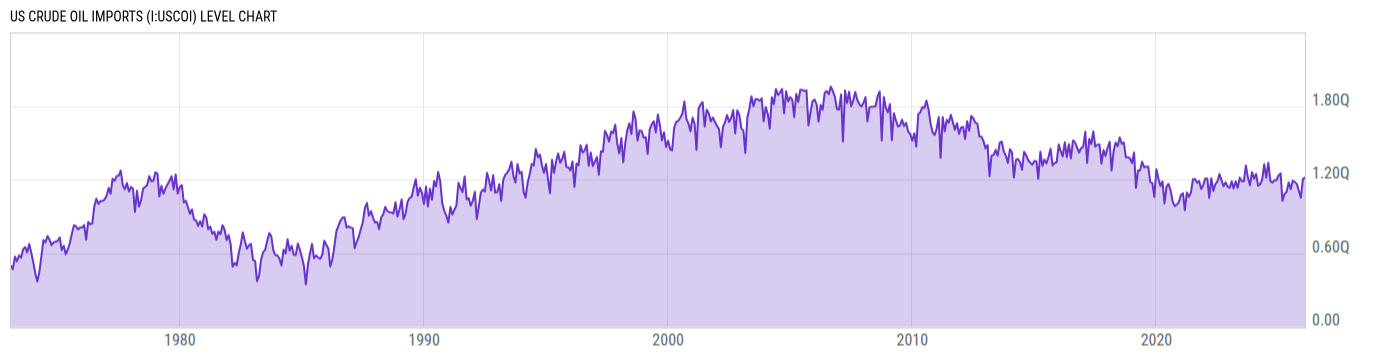
Level Chart
Basic Info
|
US Crude Oil Imports is at a current level of 1.096Q, down from 1.216Q last month and up from 1.026Q one year ago. This is a change of -9.84% from last month and 6.82% from one year ago. |
| Report | Monthly Energy Review |
| Category | Energy |
| Region | United States |
| Source | Energy Information Administration |
Stats
| Last Value | 1.096Q |
| Latest Period | Feb 2026 |
| Last Updated | May 26 2026, 14:02 EDT |
| Next Release | Jun 25 2026, 14:00 EDT |
| Average Growth Rate | 6.25% |
| Value from Last Month | 1.216Q |
| Change from Last Month | -9.84% |
| Value from 1 Year Ago | 1.026Q |
| Change from 1 Year Ago | 6.82% |
| Frequency | Monthly |
| Unit | British thermal units |
| Adjustment | N/A |
| Download Source File | |
| Notes | Excluding ethanol. |
Historical Data
| Date | Value |
|---|---|
| February 28, 2026 | 1.096Q |
| January 31, 2026 | 1.216Q |
| December 31, 2025 | 1.204Q |
| November 30, 2025 | 1.051Q |
| October 31, 2025 | 1.108Q |
| September 30, 2025 | 1.164Q |
| August 31, 2025 | 1.181Q |
| July 31, 2025 | 1.189Q |
| June 30, 2025 | 1.121Q |
| May 31, 2025 | 1.176Q |
| April 30, 2025 | 1.097Q |
| March 31, 2025 | 1.082Q |
| February 28, 2025 | 1.026Q |
| January 31, 2025 | 1.250Q |
| December 31, 2024 | 1.232Q |
| November 30, 2024 | 1.196Q |
| October 31, 2024 | 1.194Q |
| September 30, 2024 | 1.174Q |
| August 31, 2024 | 1.189Q |
| July 31, 2024 | 1.337Q |
| June 30, 2024 | 1.216Q |
| May 31, 2024 | 1.324Q |
| April 30, 2024 | 1.199Q |
| March 31, 2024 | 1.161Q |
| February 29, 2024 | 1.149Q |
| Date | Value |
|---|---|
| January 31, 2024 | 1.245Q |
| December 31, 2023 | 1.207Q |
| November 30, 2023 | 1.260Q |
| October 31, 2023 | 1.152Q |
| September 30, 2023 | 1.216Q |
| August 31, 2023 | 1.314Q |
| July 31, 2023 | 1.185Q |
| June 30, 2023 | 1.186Q |
| May 31, 2023 | 1.215Q |
| April 30, 2023 | 1.132Q |
| March 31, 2023 | 1.185Q |
| February 28, 2023 | 1.126Q |
| January 31, 2023 | 1.184Q |
| December 31, 2022 | 1.132Q |
| November 30, 2022 | 1.141Q |
| October 31, 2022 | 1.177Q |
| September 30, 2022 | 1.144Q |
| August 31, 2022 | 1.195Q |
| July 31, 2022 | 1.244Q |
| June 30, 2022 | 1.182Q |
| May 31, 2022 | 1.163Q |
| April 30, 2022 | 1.106Q |
| March 31, 2022 | 1.210Q |
| February 28, 2022 | 1.050Q |
| January 31, 2022 | 1.207Q |
News
Headline
Time (ET)
06/09 07:58
05/22 15:56
05/12 15:59
Basic Info
|
US Crude Oil Imports is at a current level of 1.096Q, down from 1.216Q last month and up from 1.026Q one year ago. This is a change of -9.84% from last month and 6.82% from one year ago. |
| Report | Monthly Energy Review |
| Category | Energy |
| Region | United States |
| Source | Energy Information Administration |
Stats
| Last Value | 1.096Q |
| Latest Period | Feb 2026 |
| Last Updated | May 26 2026, 14:02 EDT |
| Next Release | Jun 25 2026, 14:00 EDT |
| Average Growth Rate | 6.25% |
| Value from Last Month | 1.216Q |
| Change from Last Month | -9.84% |
| Value from 1 Year Ago | 1.026Q |
| Change from 1 Year Ago | 6.82% |
| Frequency | Monthly |
| Unit | British thermal units |
| Adjustment | N/A |
| Download Source File | |
| Notes | Excluding ethanol. |