

US Crude Oil Field Production (4-Week Average) (I:USCOFP4W)
13.68M bbl/d for Wk of May 22 2026
Level Chart
Basic Info
|
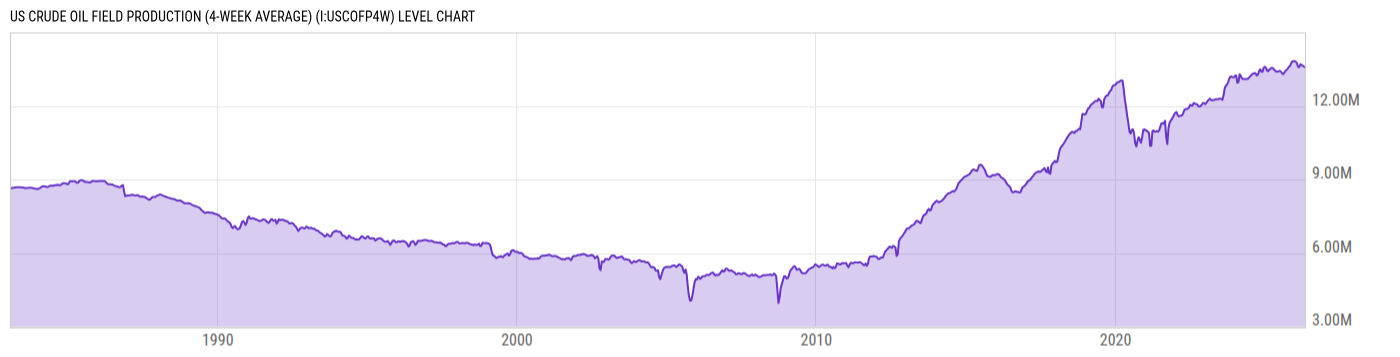
US Crude Oil Field Production (4-Week Average) is at a current level of 13.68M, up from 13.64M last week and up from 13.40M one year ago. This is a change of 0.23% from last week and 2.03% from one year ago. |
| Report | Weekly Petroleum Status |
| Category | Energy |
| Region | United States |
| Source | Energy Information Administration |
Stats
| Last Value | 13.68M |
| Latest Period | May 22 2026 |
| Last Updated | May 28 2026, 12:06 EDT |
| Average Growth Rate | 1.19% |
| Value from Last Week | 13.64M |
| Change from Last Week | 0.23% |
| Value from 1 Year Ago | 13.40M |
| Change from 1 Year Ago | 2.03% |
| Frequency | Weekly |
| Unit | Barrels per Day |
| Adjustment | N/A |
| Download Source File |
Historical Data
| Date | Value |
|---|---|
| May 22, 2026 | 13.68M |
| May 15, 2026 | 13.64M |
| May 08, 2026 | 13.61M |
| May 01, 2026 | 13.58M |
| April 24, 2026 | 13.59M |
| April 17, 2026 | 13.61M |
| April 10, 2026 | 13.63M |
| April 03, 2026 | 13.64M |
| March 27, 2026 | 13.66M |
| March 20, 2026 | 13.68M |
| March 13, 2026 | 13.69M |
| March 06, 2026 | 13.70M |
| February 27, 2026 | 13.71M |
| February 20, 2026 | 13.59M |
| February 13, 2026 | 13.59M |
| February 06, 2026 | 13.59M |
| January 30, 2026 | 13.60M |
| January 23, 2026 | 13.75M |
| January 16, 2026 | 13.78M |
| January 09, 2026 | 13.80M |
| January 02, 2026 | 13.83M |
| December 26, 2025 | 13.84M |
| December 19, 2025 | 13.83M |
| December 12, 2025 | 13.83M |
| December 05, 2025 | 13.83M |
| Date | Value |
|---|---|
| November 28, 2025 | 13.83M |
| November 21, 2025 | 13.79M |
| November 14, 2025 | 13.75M |
| November 07, 2025 | 13.70M |
| October 31, 2025 | 13.64M |
| October 24, 2025 | 13.64M |
| October 17, 2025 | 13.60M |
| October 10, 2025 | 13.57M |
| October 03, 2025 | 13.53M |
| September 26, 2025 | 13.50M |
| September 19, 2025 | 13.48M |
| September 12, 2025 | 13.46M |
| September 05, 2025 | 13.44M |
| August 29, 2025 | 13.39M |
| August 22, 2025 | 13.36M |
| August 15, 2025 | 13.33M |
| August 08, 2025 | 13.30M |
| August 01, 2025 | 13.31M |
| July 25, 2025 | 13.34M |
| July 18, 2025 | 13.37M |
| July 11, 2025 | 13.41M |
| July 04, 2025 | 13.42M |
| June 27, 2025 | 13.43M |
| June 20, 2025 | 13.43M |
| June 13, 2025 | 13.42M |
News
Headline
Time (ET)
06/01 14:42
05/27 06:13
05/21 14:40
05/20 16:03
05/13 14:39
Basic Info
|
US Crude Oil Field Production (4-Week Average) is at a current level of 13.68M, up from 13.64M last week and up from 13.40M one year ago. This is a change of 0.23% from last week and 2.03% from one year ago. |
| Report | Weekly Petroleum Status |
| Category | Energy |
| Region | United States |
| Source | Energy Information Administration |
Stats
| Last Value | 13.68M |
| Latest Period | May 22 2026 |
| Last Updated | May 28 2026, 12:06 EDT |
| Average Growth Rate | 1.19% |
| Value from Last Week | 13.64M |
| Change from Last Week | 0.23% |
| Value from 1 Year Ago | 13.40M |
| Change from 1 Year Ago | 2.03% |
| Frequency | Weekly |
| Unit | Barrels per Day |
| Adjustment | N/A |
| Download Source File |