

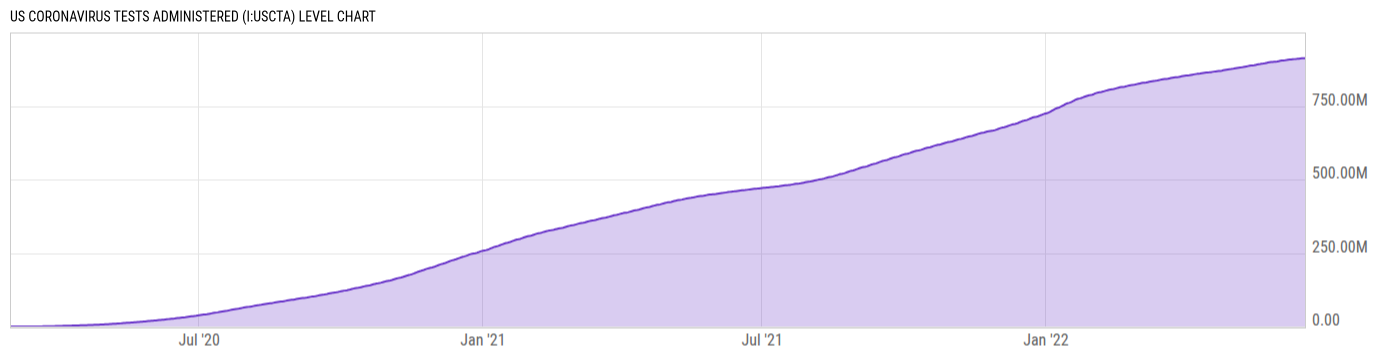
US Coronavirus Tests Administered (I:USCTA)
912.77M for Jun 18 2022
Level Chart
Basic Info
|
US Coronavirus Tests Administered is at a current level of 912.77M, up from 912.52M yesterday and up from 463.33M one year ago. This is a change of 0.03% from yesterday and 97.00% from one year ago. |
| Report | Coronavirus (COVID-19) Testing by Country |
| Category | Public Health |
| Region | United States |
| Source | Our World in Data |
Stats
| Last Value | 912.77M |
| Latest Period | Jun 18 2022 |
| Last Updated | Aug 12 2022, 13:00 EDT |
| Next Release | May 22 2026, 13:00 EDT (R) (E) |
| Average Growth Rate | 725.3% |
| Value from Yesterday | 912.52M |
| Change from Yesterday | 0.03% |
| Value from 1 Year Ago | 463.33M |
| Change from 1 Year Ago | 97.00% |
| Frequency | Daily |
| Adjustment | N/A |
| Download Source File |
Historical Data
| Date | Value |
|---|---|
| June 18, 2022 | 912.77M |
| June 17, 2022 | 912.52M |
| June 16, 2022 | 912.12M |
| June 15, 2022 | 911.64M |
| June 14, 2022 | 911.04M |
| June 13, 2022 | 910.34M |
| June 12, 2022 | 909.79M |
| June 11, 2022 | 909.44M |
| June 10, 2022 | 909.00M |
| June 09, 2022 | 908.48M |
| June 08, 2022 | 907.96M |
| June 07, 2022 | 907.16M |
| June 06, 2022 | 906.21M |
| June 05, 2022 | 905.56M |
| June 04, 2022 | 905.17M |
| June 03, 2022 | 904.54M |
| June 02, 2022 | 903.59M |
| June 01, 2022 | 902.48M |
| May 31, 2022 | 901.41M |
| May 30, 2022 | 900.69M |
| May 29, 2022 | 900.39M |
| May 28, 2022 | 900.04M |
| May 27, 2022 | 899.46M |
| May 26, 2022 | 898.63M |
| May 25, 2022 | 897.61M |
| Date | Value |
|---|---|
| May 24, 2022 | 896.49M |
| May 23, 2022 | 895.27M |
| May 22, 2022 | 894.49M |
| May 21, 2022 | 894.08M |
| May 20, 2022 | 892.75M |
| May 19, 2022 | 891.92M |
| May 18, 2022 | 890.92M |
| May 17, 2022 | 889.78M |
| May 16, 2022 | 888.65M |
| May 15, 2022 | 887.88M |
| May 14, 2022 | 887.50M |
| May 13, 2022 | 886.62M |
| May 12, 2022 | 885.67M |
| May 11, 2022 | 884.65M |
| May 10, 2022 | 883.54M |
| May 09, 2022 | 882.33M |
| May 08, 2022 | 881.61M |
| May 07, 2022 | 881.25M |
| May 06, 2022 | 880.42M |
| May 05, 2022 | 879.47M |
| May 04, 2022 | 878.51M |
| May 03, 2022 | 877.29M |
| May 02, 2022 | 876.28M |
| May 01, 2022 | 875.62M |
| April 30, 2022 | 875.29M |
News
Headline
Time (ET)
04/21 06:30
Basic Info
|
US Coronavirus Tests Administered is at a current level of 912.77M, up from 912.52M yesterday and up from 463.33M one year ago. This is a change of 0.03% from yesterday and 97.00% from one year ago. |
| Report | Coronavirus (COVID-19) Testing by Country |
| Category | Public Health |
| Region | United States |
| Source | Our World in Data |
Stats
| Last Value | 912.77M |
| Latest Period | Jun 18 2022 |
| Last Updated | Aug 12 2022, 13:00 EDT |
| Next Release | May 22 2026, 13:00 EDT (R) (E) |
| Average Growth Rate | 725.3% |
| Value from Yesterday | 912.52M |
| Change from Yesterday | 0.03% |
| Value from 1 Year Ago | 463.33M |
| Change from 1 Year Ago | 97.00% |
| Frequency | Daily |
| Adjustment | N/A |
| Download Source File |