

US Core PCE Price Index (I:USCPCEPI)
129.28 for Mar 2026
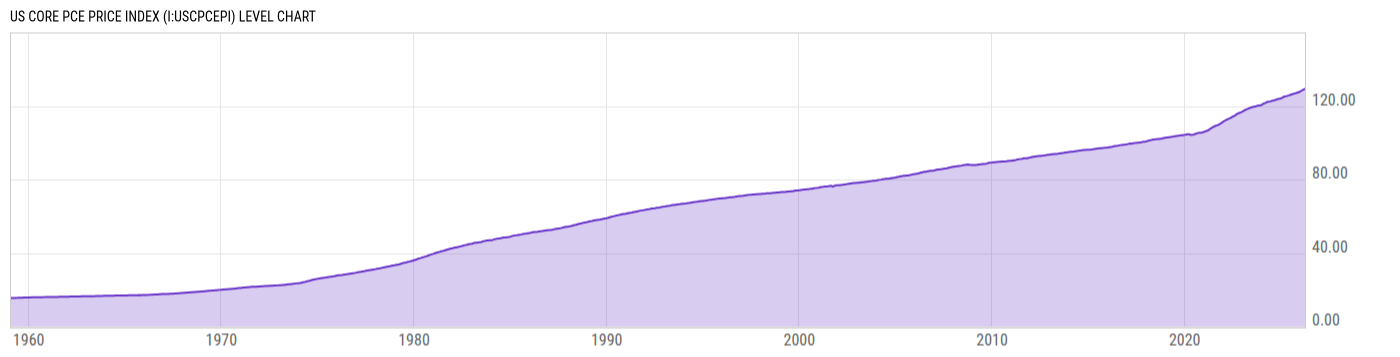
Level Chart
Basic Info
|
US Core PCE Price Index is at a current level of 129.28, up from 128.90 last month and up from 125.27 one year ago. This is a change of 0.29% from last month and 3.20% from one year ago. |
| Report | Personal Income and Outlays |
| Category | Consumer & Household Statistics |
| Region | United States |
| Source | Bureau of Economic Analysis |
Stats
| Last Value | 129.28 |
| Latest Period | Mar 2026 |
| Last Updated | Apr 30 2026, 11:58 EDT |
| Next Release | May 28 2026, 08:30 EDT |
| Average Growth Rate | 3.16% |
| Value from Last Month | 128.90 |
| Change from Last Month | 0.29% |
| Value from 1 Year Ago | 125.27 |
| Change from 1 Year Ago | 3.20% |
| Frequency | Monthly |
| Unit | Index 2017=100 |
| Adjustment | Seasonally Adjusted |
| Download Source File | |
| Notes | Chain-type price index, less food and energy. |
Historical Data
| Date | Value |
|---|---|
| March 31, 2026 | 129.28 |
| February 28, 2026 | 128.90 |
| January 31, 2026 | 128.43 |
| December 31, 2025 | 127.89 |
| November 30, 2025 | 127.47 |
| October 31, 2025 | 127.24 |
| September 30, 2025 | 126.95 |
| August 31, 2025 | 126.71 |
| July 31, 2025 | 126.43 |
| June 30, 2025 | 126.12 |
| May 31, 2025 | 125.79 |
| April 30, 2025 | 125.50 |
| March 31, 2025 | 125.27 |
| February 28, 2025 | 125.14 |
| January 31, 2025 | 124.59 |
| December 31, 2024 | 124.20 |
| November 30, 2024 | 123.96 |
| October 31, 2024 | 123.83 |
| September 30, 2024 | 123.47 |
| August 31, 2024 | 123.13 |
| July 31, 2024 | 122.91 |
| June 30, 2024 | 122.68 |
| May 31, 2024 | 122.38 |
| April 30, 2024 | 122.30 |
| March 31, 2024 | 122.01 |
| Date | Value |
|---|---|
| February 29, 2024 | 121.54 |
| January 31, 2024 | 121.22 |
| December 31, 2023 | 120.59 |
| November 30, 2023 | 120.37 |
| October 31, 2023 | 120.24 |
| September 30, 2023 | 120.06 |
| August 31, 2023 | 119.69 |
| July 31, 2023 | 119.54 |
| June 30, 2023 | 119.37 |
| May 31, 2023 | 119.06 |
| April 30, 2023 | 118.72 |
| March 31, 2023 | 118.30 |
| February 28, 2023 | 117.96 |
| January 31, 2023 | 117.53 |
| December 31, 2022 | 116.98 |
| November 30, 2022 | 116.55 |
| October 31, 2022 | 116.20 |
| September 30, 2022 | 115.80 |
| August 31, 2022 | 115.30 |
| July 31, 2022 | 114.53 |
| June 30, 2022 | 114.30 |
| May 31, 2022 | 113.66 |
| April 30, 2022 | 113.25 |
| March 31, 2022 | 112.88 |
| February 28, 2022 | 112.44 |
News
Headline
Time (ET)
04/30 13:32
04/30 07:48
Basic Info
|
US Core PCE Price Index is at a current level of 129.28, up from 128.90 last month and up from 125.27 one year ago. This is a change of 0.29% from last month and 3.20% from one year ago. |
| Report | Personal Income and Outlays |
| Category | Consumer & Household Statistics |
| Region | United States |
| Source | Bureau of Economic Analysis |
Stats
| Last Value | 129.28 |
| Latest Period | Mar 2026 |
| Last Updated | Apr 30 2026, 11:58 EDT |
| Next Release | May 28 2026, 08:30 EDT |
| Average Growth Rate | 3.16% |
| Value from Last Month | 128.90 |
| Change from Last Month | 0.29% |
| Value from 1 Year Ago | 125.27 |
| Change from 1 Year Ago | 3.20% |
| Frequency | Monthly |
| Unit | Index 2017=100 |
| Adjustment | Seasonally Adjusted |
| Download Source File | |
| Notes | Chain-type price index, less food and energy. |