

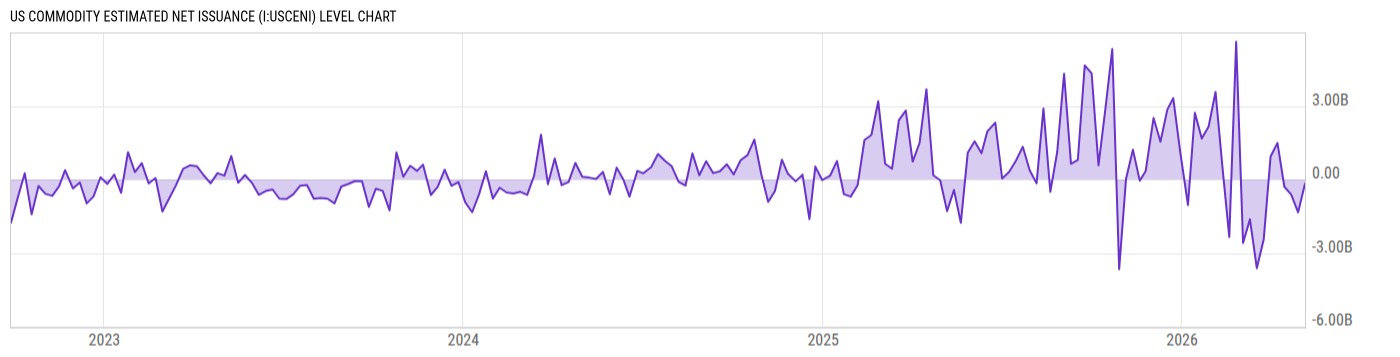
US Commodity Estimated Net Issuance (I:USCENI)
-87.00M USD for Wk of May 27 2026
Level Chart
Basic Info
|
US Commodity Estimated Net Issuance is at a current level of -87.00M, down from 70.00M last week and up from -1.771B one year ago. This is a change of N/A from last week. |
| Report | Weekly Estimated ETF Net Issuance |
| Category | Financial Sector Statistics |
| Region | United States |
| Source | Investment Company Institute |
Stats
| Last Value | -87.00M |
| Latest Period | May 27 2026 |
| Last Updated | Jun 2 2026, 10:02 EDT |
| Next Release | Jun 9 2026, 10:00 EDT (E) |
| Average Growth Rate | -32.86% |
| Value from Last Week | 70.00M |
| Change from Last Week | N/A |
| Value from 1 Year Ago | -1.771B |
| Change from 1 Year Ago | N/A |
| Frequency | Weekly |
| Unit | USD |
| Adjustment | N/A |
| Download Source File |
Historical Data
| Date | Value |
|---|---|
| May 27, 2026 | -87.00M |
| May 20, 2026 | 70.00M |
| May 13, 2026 | 1.956B |
| May 06, 2026 | -170.00M |
| April 29, 2026 | -1.339B |
| April 22, 2026 | -620.00M |
| April 15, 2026 | -295.00M |
| April 08, 2026 | 1.492B |
| April 01, 2026 | 940.00M |
| March 25, 2026 | -2.451B |
| March 18, 2026 | -3.619B |
| March 11, 2026 | -1.628B |
| March 04, 2026 | -2.591B |
| February 25, 2026 | 5.619B |
| February 18, 2026 | -2.349B |
| February 11, 2026 | 523.00M |
| February 04, 2026 | 3.573B |
| January 28, 2026 | 2.161B |
| January 21, 2026 | 1.669B |
| January 14, 2026 | 2.723B |
| January 07, 2026 | -1.041B |
| December 30, 2025 | 1.159B |
| December 23, 2025 | 3.32B |
| December 17, 2025 | 2.852B |
| December 10, 2025 | 1.539B |
| Date | Value |
|---|---|
| December 03, 2025 | 2.513B |
| November 25, 2025 | 350.00M |
| November 19, 2025 | -55.00M |
| November 12, 2025 | 1.214B |
| November 05, 2025 | 28.00M |
| October 29, 2025 | -3.664B |
| October 22, 2025 | 5.326B |
| October 15, 2025 | 2.885B |
| October 08, 2025 | 577.00M |
| October 01, 2025 | 4.328B |
| September 24, 2025 | 4.658B |
| September 17, 2025 | 804.00M |
| September 10, 2025 | 642.00M |
| September 03, 2025 | 4.316B |
| August 27, 2025 | 1.123B |
| August 20, 2025 | -505.00M |
| August 13, 2025 | 2.895B |
| August 06, 2025 | -158.00M |
| July 30, 2025 | 380.00M |
| July 23, 2025 | 1.334B |
| July 16, 2025 | 767.00M |
| July 09, 2025 | 310.00M |
| July 02, 2025 | 41.00M |
| June 25, 2025 | 2.323B |
| June 17, 2025 | 1.967B |
News
Headline
Time (ET)
Basic Info
|
US Commodity Estimated Net Issuance is at a current level of -87.00M, down from 70.00M last week and up from -1.771B one year ago. This is a change of N/A from last week. |
| Report | Weekly Estimated ETF Net Issuance |
| Category | Financial Sector Statistics |
| Region | United States |
| Source | Investment Company Institute |
Stats
| Last Value | -87.00M |
| Latest Period | May 27 2026 |
| Last Updated | Jun 2 2026, 10:02 EDT |
| Next Release | Jun 9 2026, 10:00 EDT (E) |
| Average Growth Rate | -32.86% |
| Value from Last Week | 70.00M |
| Change from Last Week | N/A |
| Value from 1 Year Ago | -1.771B |
| Change from 1 Year Ago | N/A |
| Frequency | Weekly |
| Unit | USD |
| Adjustment | N/A |
| Download Source File |