

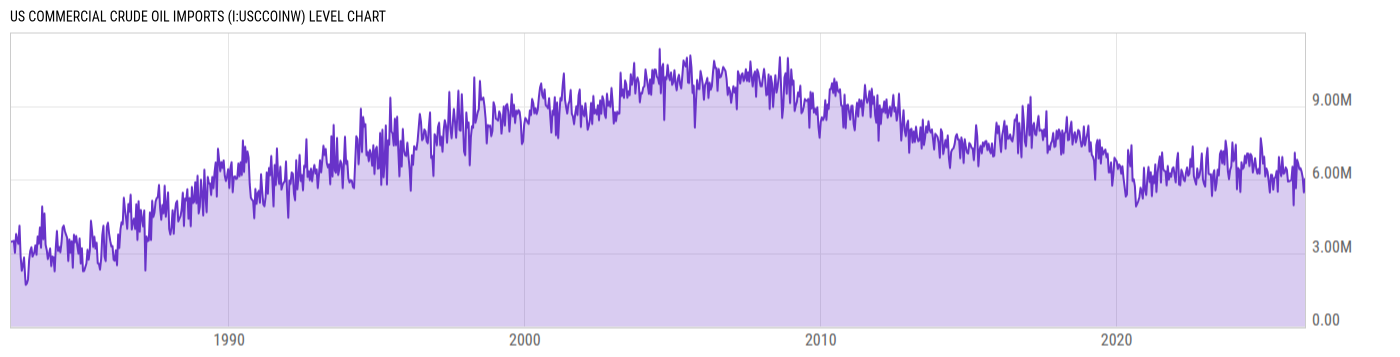
US Commercial Crude Oil Imports (I:USCCOINW)
6.016M bbl/d for Wk of May 15 2026
Level Chart
Basic Info
|
US Commercial Crude Oil Imports is at a current level of 6.016M, up from 5.901M last week and up from 5.841M one year ago. This is a change of 1.95% from last week and 3.00% from one year ago. |
| Report | Weekly Petroleum Status |
| Category | Energy |
| Region | N/A |
| Source | Energy Information Administration |
Stats
| Last Value | 6.016M |
| Latest Period | May 15 2026 |
| Last Updated | May 20 2026, 12:05 EDT |
| Next Release | May 28 2026, 12:00 EDT |
| Average Growth Rate | 35.93% |
| Value from Last Week | 5.901M |
| Change from Last Week | 1.95% |
| Value from 1 Year Ago | 5.841M |
| Change from 1 Year Ago | 3.00% |
| Frequency | Weekly |
| Unit | Barrels per Day |
| Adjustment | N/A |
| Download Source File |
Historical Data
| Date | Value |
|---|---|
| May 15, 2026 | 6.016M |
| May 08, 2026 | 5.901M |
| May 01, 2026 | 5.477M |
| April 24, 2026 | 5.75M |
| April 17, 2026 | 6.078M |
| April 10, 2026 | 5.291M |
| April 03, 2026 | 6.324M |
| March 27, 2026 | 6.454M |
| March 20, 2026 | 6.464M |
| March 13, 2026 | 7.194M |
| March 06, 2026 | 6.422M |
| February 27, 2026 | 6.324M |
| February 20, 2026 | 6.659M |
| February 13, 2026 | 6.524M |
| February 06, 2026 | 6.805M |
| January 30, 2026 | 6.201M |
| January 23, 2026 | 5.642M |
| January 16, 2026 | 6.447M |
| January 09, 2026 | 7.092M |
| January 02, 2026 | 6.339M |
| December 26, 2025 | 4.953M |
| December 19, 2025 | 6.086M |
| December 12, 2025 | 6.525M |
| December 05, 2025 | 6.589M |
| November 28, 2025 | 5.981M |
| Date | Value |
|---|---|
| November 21, 2025 | 6.436M |
| November 14, 2025 | 5.95M |
| November 07, 2025 | 5.222M |
| October 31, 2025 | 5.924M |
| October 24, 2025 | 5.051M |
| October 17, 2025 | 5.918M |
| October 10, 2025 | 5.525M |
| October 03, 2025 | 6.403M |
| September 26, 2025 | 5.833M |
| September 19, 2025 | 6.495M |
| September 12, 2025 | 5.692M |
| September 05, 2025 | 6.271M |
| August 29, 2025 | 6.742M |
| August 22, 2025 | 6.234M |
| August 15, 2025 | 6.497M |
| August 08, 2025 | 6.92M |
| August 01, 2025 | 5.962M |
| July 25, 2025 | 6.136M |
| July 18, 2025 | 5.976M |
| July 11, 2025 | 6.379M |
| July 04, 2025 | 6.013M |
| June 27, 2025 | 6.919M |
| June 20, 2025 | 5.944M |
| June 13, 2025 | 5.504M |
| June 06, 2025 | 6.176M |
News
Headline
Time (ET)
05/21 14:40
05/20 16:03
05/13 14:39
Basic Info
|
US Commercial Crude Oil Imports is at a current level of 6.016M, up from 5.901M last week and up from 5.841M one year ago. This is a change of 1.95% from last week and 3.00% from one year ago. |
| Report | Weekly Petroleum Status |
| Category | Energy |
| Region | N/A |
| Source | Energy Information Administration |
Stats
| Last Value | 6.016M |
| Latest Period | May 15 2026 |
| Last Updated | May 20 2026, 12:05 EDT |
| Next Release | May 28 2026, 12:00 EDT |
| Average Growth Rate | 35.93% |
| Value from Last Week | 5.901M |
| Change from Last Week | 1.95% |
| Value from 1 Year Ago | 5.841M |
| Change from 1 Year Ago | 3.00% |
| Frequency | Weekly |
| Unit | Barrels per Day |
| Adjustment | N/A |
| Download Source File |