

US Coal Production (I:USCP)
0.8511Q Btu for Feb 2026
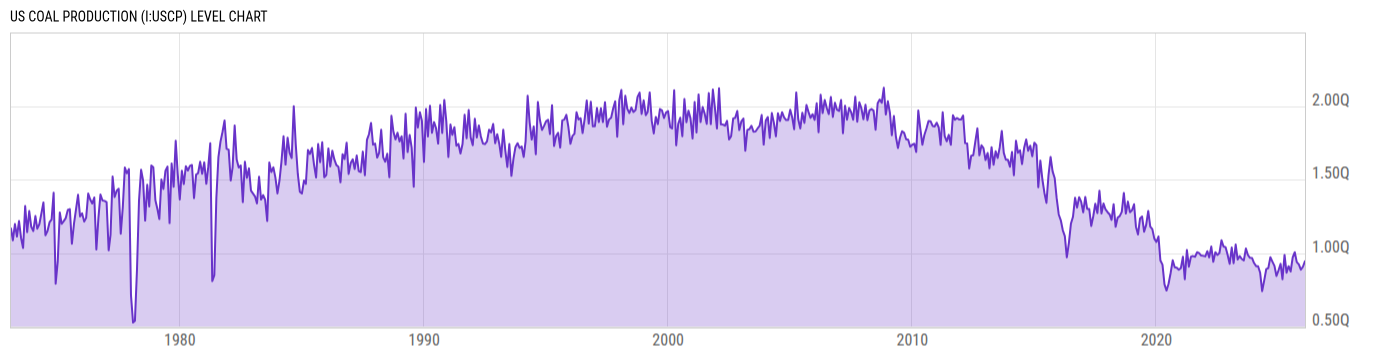
Level Chart
Basic Info
|
US Coal Production is at a current level of 0.8511Q, down from 0.9405Q last month and up from 0.8187Q one year ago. This is a change of -9.50% from last month and 3.96% from one year ago. |
| Report | Monthly Energy Review |
| Category | Energy |
| Region | United States |
| Source | Energy Information Administration |
Stats
| Last Value | 0.8511Q |
| Latest Period | Feb 2026 |
| Last Updated | May 26 2026, 14:02 EDT |
| Next Release | Jun 25 2026, 14:00 EDT |
| Average Growth Rate | 5.74% |
| Value from Last Month | 0.9405Q |
| Change from Last Month | -9.50% |
| Value from 1 Year Ago | 0.8187Q |
| Change from 1 Year Ago | 3.96% |
| Frequency | Monthly |
| Unit | British thermal units |
| Adjustment | N/A |
| Download Source File |
Historical Data
| Date | Value |
|---|---|
| February 28, 2026 | 0.8511Q |
| January 31, 2026 | 0.9405Q |
| December 31, 2025 | 0.9091Q |
| November 30, 2025 | 0.8899Q |
| October 31, 2025 | 0.9159Q |
| September 30, 2025 | 0.9002Q |
| August 31, 2025 | 0.9669Q |
| July 31, 2025 | 0.9302Q |
| June 30, 2025 | 0.8706Q |
| May 31, 2025 | 0.9067Q |
| April 30, 2025 | 0.8627Q |
| March 31, 2025 | 0.9831Q |
| February 28, 2025 | 0.8187Q |
| January 31, 2025 | 0.922Q |
| December 31, 2024 | 0.8822Q |
| November 30, 2024 | 0.8437Q |
| October 31, 2024 | 0.9121Q |
| September 30, 2024 | 0.9418Q |
| August 31, 2024 | 0.9716Q |
| July 31, 2024 | 0.8974Q |
| June 30, 2024 | 0.8896Q |
| May 31, 2024 | 0.8136Q |
| April 30, 2024 | 0.7406Q |
| March 31, 2024 | 0.8656Q |
| February 29, 2024 | 0.9099Q |
| Date | Value |
|---|---|
| January 31, 2024 | 0.9106Q |
| December 31, 2023 | 0.9317Q |
| November 30, 2023 | 0.9667Q |
| October 31, 2023 | 0.9669Q |
| September 30, 2023 | 0.9864Q |
| August 31, 2023 | 1.030Q |
| July 31, 2023 | 0.9497Q |
| June 30, 2023 | 0.9592Q |
| May 31, 2023 | 0.9789Q |
| April 30, 2023 | 0.955Q |
| March 31, 2023 | 1.057Q |
| February 28, 2023 | 0.9307Q |
| January 31, 2023 | 1.037Q |
| December 31, 2022 | 0.9261Q |
| November 30, 2022 | 0.9884Q |
| October 31, 2022 | 1.040Q |
| September 30, 2022 | 1.044Q |
| August 31, 2022 | 1.086Q |
| July 31, 2022 | 1.000Q |
| June 30, 2022 | 0.9864Q |
| May 31, 2022 | 1.006Q |
| April 30, 2022 | 0.9399Q |
| March 31, 2022 | 1.044Q |
| February 28, 2022 | 0.9703Q |
| January 31, 2022 | 1.012Q |
News
Headline
Time (ET)
06/09 07:58
05/22 15:56
05/12 15:59
Basic Info
|
US Coal Production is at a current level of 0.8511Q, down from 0.9405Q last month and up from 0.8187Q one year ago. This is a change of -9.50% from last month and 3.96% from one year ago. |
| Report | Monthly Energy Review |
| Category | Energy |
| Region | United States |
| Source | Energy Information Administration |
Stats
| Last Value | 0.8511Q |
| Latest Period | Feb 2026 |
| Last Updated | May 26 2026, 14:02 EDT |
| Next Release | Jun 25 2026, 14:00 EDT |
| Average Growth Rate | 5.74% |
| Value from Last Month | 0.9405Q |
| Change from Last Month | -9.50% |
| Value from 1 Year Ago | 0.8187Q |
| Change from 1 Year Ago | 3.96% |
| Frequency | Monthly |
| Unit | British thermal units |
| Adjustment | N/A |
| Download Source File |