

US Coal Exports (I:USCENM)
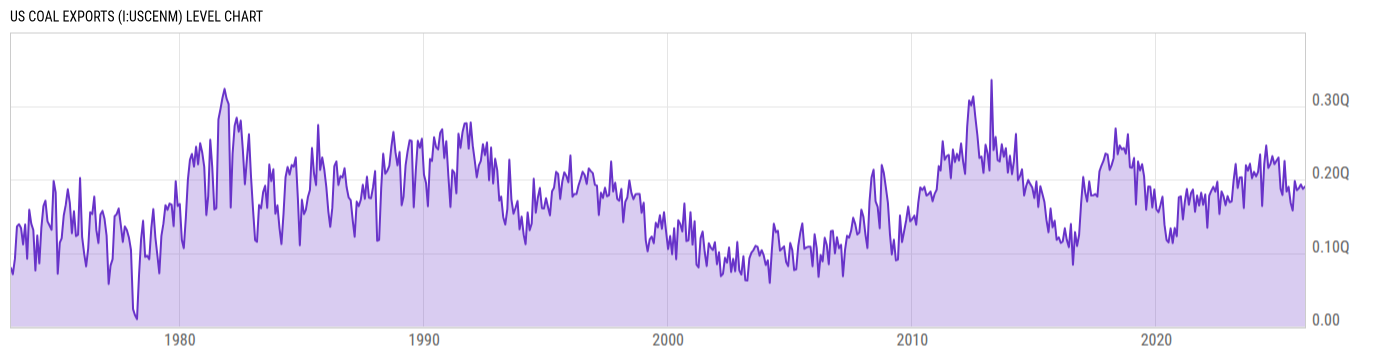
0.1903Q Btu for Jan 2026
Level Chart
Basic Info
|
US Coal Exports is at a current level of 0.1903Q, up from 0.1871Q last month and up from 0.1872Q one year ago. This is a change of 1.67% from last month and 1.65% from one year ago. |
| Report | Monthly Energy Review |
| Category | Energy |
| Region | United States |
| Source | Energy Information Administration |
Stats
| Last Value | 0.1903Q |
| Latest Period | Jan 2026 |
| Last Updated | Apr 27 2026, 18:14 EDT |
| Next Release | May 26 2026, 14:00 EDT |
| Average Growth Rate | 35.47% |
| Value from Last Month | 0.1872Q |
| Change from Last Month | 1.67% |
| Value from 1 Year Ago | 0.1872Q |
| Change from 1 Year Ago | 1.65% |
| Frequency | Monthly |
| Unit | British thermal units |
| Adjustment | N/A |
| Download Source File |
Historical Data
| Date | Value |
|---|---|
| January 31, 2026 | 0.1903Q |
| December 31, 2025 | 0.1872Q |
| November 30, 2025 | 0.1932Q |
| October 31, 2025 | 0.1881Q |
| September 30, 2025 | 0.1855Q |
| August 31, 2025 | 0.1979Q |
| July 31, 2025 | 0.1579Q |
| June 30, 2025 | 0.1684Q |
| May 31, 2025 | 0.19Q |
| April 30, 2025 | 0.1837Q |
| March 31, 2025 | 0.2253Q |
| February 28, 2025 | 0.179Q |
| January 31, 2025 | 0.1872Q |
| December 31, 2024 | 0.2299Q |
| November 30, 2024 | 0.2254Q |
| October 31, 2024 | 0.2209Q |
| September 30, 2024 | 0.2318Q |
| August 31, 2024 | 0.2209Q |
| July 31, 2024 | 0.2157Q |
| June 30, 2024 | 0.2462Q |
| May 31, 2024 | 0.221Q |
| April 30, 2024 | 0.1639Q |
| March 31, 2024 | 0.2341Q |
| February 29, 2024 | 0.2103Q |
| January 31, 2024 | 0.2042Q |
| Date | Value |
|---|---|
| December 31, 2023 | 0.2104Q |
| November 30, 2023 | 0.2018Q |
| October 31, 2023 | 0.2214Q |
| September 30, 2023 | 0.2121Q |
| August 31, 2023 | 0.2194Q |
| July 31, 2023 | 0.1612Q |
| June 30, 2023 | 0.2029Q |
| May 31, 2023 | 0.2028Q |
| April 30, 2023 | 0.1885Q |
| March 31, 2023 | 0.2211Q |
| February 28, 2023 | 0.1986Q |
| January 31, 2023 | 0.1704Q |
| December 31, 2022 | 0.169Q |
| November 30, 2022 | 0.1774Q |
| October 31, 2022 | 0.1651Q |
| September 30, 2022 | 0.1772Q |
| August 31, 2022 | 0.1837Q |
| July 31, 2022 | 0.1531Q |
| June 30, 2022 | 0.197Q |
| May 31, 2022 | 0.1835Q |
| April 30, 2022 | 0.19Q |
| March 31, 2022 | 0.1845Q |
| February 28, 2022 | 0.1779Q |
| January 31, 2022 | 0.1343Q |
| December 31, 2021 | 0.1795Q |
News
Headline
Time (ET)
05/12 15:59
04/23 08:36
Basic Info
|
US Coal Exports is at a current level of 0.1903Q, up from 0.1871Q last month and up from 0.1872Q one year ago. This is a change of 1.67% from last month and 1.65% from one year ago. |
| Report | Monthly Energy Review |
| Category | Energy |
| Region | United States |
| Source | Energy Information Administration |
Stats
| Last Value | 0.1903Q |
| Latest Period | Jan 2026 |
| Last Updated | Apr 27 2026, 18:14 EDT |
| Next Release | May 26 2026, 14:00 EDT |
| Average Growth Rate | 35.47% |
| Value from Last Month | 0.1872Q |
| Change from Last Month | 1.67% |
| Value from 1 Year Ago | 0.1872Q |
| Change from 1 Year Ago | 1.65% |
| Frequency | Monthly |
| Unit | British thermal units |
| Adjustment | N/A |
| Download Source File |