

US Capacity Utilization YoY (I:USCCU)
0.02% for Apr 2026
Level Chart
Basic Info
|
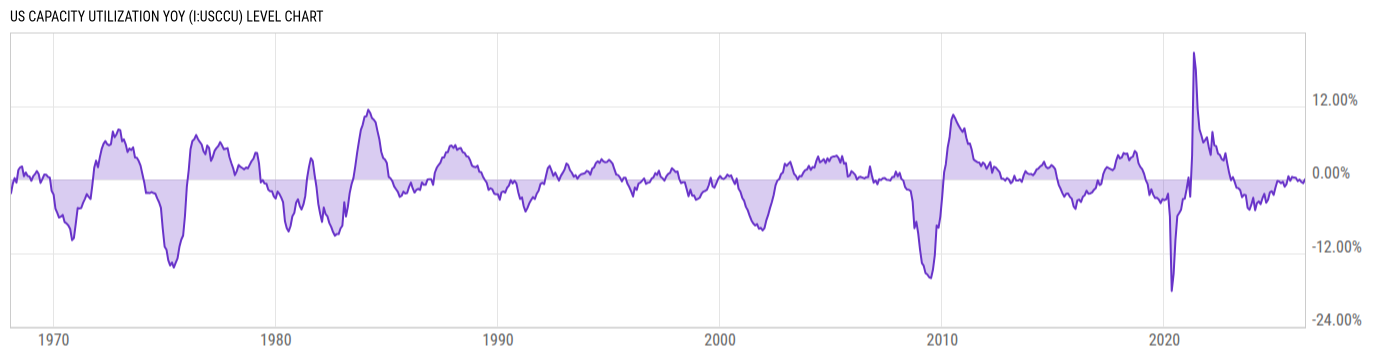
US Capacity Utilization YoY is at 0.02%, compared to -0.60% last month and -0.36% last year. This is higher than the long term average of -0.13%. |
| Report | G.17 Industrial Production and Capacity Utilization |
| Category | Manufacturing Business Statistics |
| Region | United States |
| Source | Federal Reserve |
Stats
| Last Value | 0.02% |
| Latest Period | Apr 2026 |
| Last Updated | May 15 2026, 09:18 EDT |
| Next Release | Jun 15 2026, 09:15 EDT |
| Long Term Average | -0.13% |
| Average Growth Rate | -0.02% |
| Value from Last Month | -0.60% |
| Change from Last Month | N/A |
| Value from 1 Year Ago | -0.36% |
| Change from 1 Year Ago | N/A |
| Frequency | Monthly |
| Unit | Percent |
| Adjustment | Seasonally Adjusted |
| Download Source File |
Historical Data
| Date | Value |
|---|---|
| April 30, 2026 | 0.02% |
| March 31, 2026 | -0.60% |
| February 28, 2026 | -0.40% |
| January 31, 2026 | -0.02% |
| December 31, 2025 | -0.27% |
| November 30, 2025 | 0.30% |
| October 31, 2025 | 0.31% |
| September 30, 2025 | 0.43% |
| August 31, 2025 | -0.22% |
| July 31, 2025 | 0.53% |
| June 30, 2025 | -0.75% |
| May 31, 2025 | -1.18% |
| April 30, 2025 | -0.36% |
| March 31, 2025 | -0.61% |
| February 28, 2025 | -0.32% |
| January 31, 2025 | -0.23% |
| December 31, 2024 | -1.29% |
| November 30, 2024 | -2.52% |
| October 31, 2024 | -1.92% |
| September 30, 2024 | -2.09% |
| August 31, 2024 | -3.31% |
| July 31, 2024 | -3.79% |
| June 30, 2024 | -2.34% |
| May 31, 2024 | -3.05% |
| April 30, 2024 | -4.01% |
| Date | Value |
|---|---|
| March 31, 2024 | -3.57% |
| February 29, 2024 | -3.89% |
| January 31, 2024 | -5.02% |
| December 31, 2023 | -2.99% |
| November 30, 2023 | -4.11% |
| October 31, 2023 | -4.94% |
| September 30, 2023 | -4.63% |
| August 31, 2023 | -2.58% |
| July 31, 2023 | -2.49% |
| June 30, 2023 | -2.89% |
| May 31, 2023 | -1.75% |
| April 30, 2023 | -1.41% |
| March 31, 2023 | -1.34% |
| February 28, 2023 | -0.40% |
| January 31, 2023 | 0.41% |
| December 31, 2022 | -0.12% |
| November 30, 2022 | 1.08% |
| October 31, 2022 | 2.60% |
| September 30, 2022 | 4.28% |
| August 31, 2022 | 3.12% |
| July 31, 2022 | 3.31% |
| June 30, 2022 | 4.04% |
| May 31, 2022 | 4.21% |
| April 30, 2022 | 5.45% |
| March 31, 2022 | 5.60% |
News
Headline
Time (ET)
05/13 17:00
05/13 15:57
05/01 12:49
Basic Info
|
US Capacity Utilization YoY is at 0.02%, compared to -0.60% last month and -0.36% last year. This is higher than the long term average of -0.13%. |
| Report | G.17 Industrial Production and Capacity Utilization |
| Category | Manufacturing Business Statistics |
| Region | United States |
| Source | Federal Reserve |
Stats
| Last Value | 0.02% |
| Latest Period | Apr 2026 |
| Last Updated | May 15 2026, 09:18 EDT |
| Next Release | Jun 15 2026, 09:15 EDT |
| Long Term Average | -0.13% |
| Average Growth Rate | -0.02% |
| Value from Last Month | -0.60% |
| Change from Last Month | N/A |
| Value from 1 Year Ago | -0.36% |
| Change from 1 Year Ago | N/A |
| Frequency | Monthly |
| Unit | Percent |
| Adjustment | Seasonally Adjusted |
| Download Source File |