

US Car Retail Sales (DISCONTINUED) (I:USCRS)
5.135M for Aug 2018
Level Chart
Basic Info
|
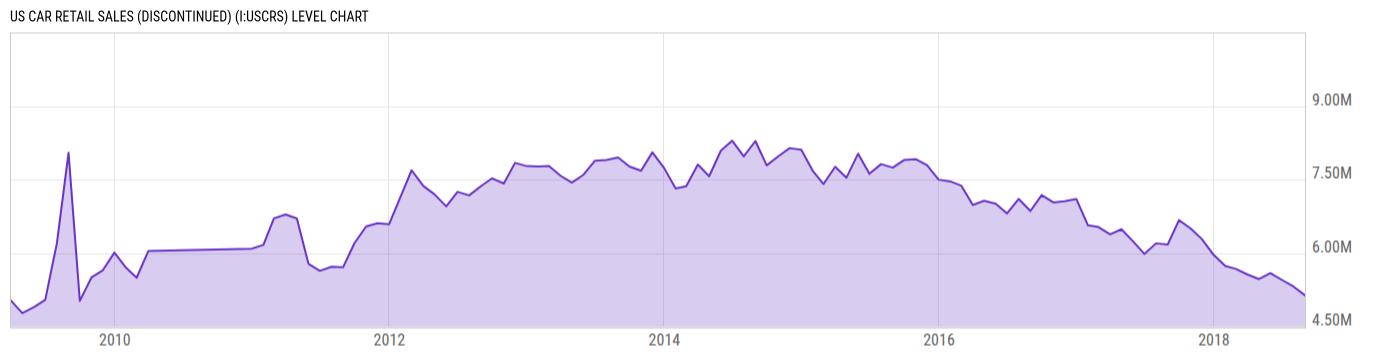
US Car Retail Sales is at a current level of 5.135M, down from 5.317M last month and down from 6.173M one year ago. This is a change of -3.42% from last month and -16.80% from one year ago. |
| Report | Motor Intelligence Light Vehicle Retail Sales |
| Category | Retail and Services Business Statistics |
| Region | United States |
| Source | Motor Intelligence |
Stats
| Last Value | 5.135M |
| Latest Period | Aug 2018 |
| Last Updated | Sep 6 2018, 13:39 EDT |
| Average Growth Rate | 2.95% |
| Value from Last Month | 5.317M |
| Change from Last Month | -3.42% |
| Value from 1 Year Ago | 6.173M |
| Change from 1 Year Ago | -16.80% |
| Frequency | Monthly |
| Adjustment | Seasonally Adjusted Annual Rate |
| Download Source File |
Historical Data
| Date | Value |
|---|---|
| August 31, 2018 | 5.136M |
| July 31, 2018 | 5.317M |
| June 30, 2018 | 5.454M |
| May 31, 2018 | 5.589M |
| April 30, 2018 | 5.468M |
| March 31, 2018 | 5.562M |
| February 28, 2018 | 5.676M |
| January 31, 2018 | 5.735M |
| December 31, 2017 | 5.963M |
| November 30, 2017 | 6.283M |
| October 31, 2017 | 6.501M |
| September 30, 2017 | 6.670M |
| August 31, 2017 | 6.173M |
| July 31, 2017 | 6.196M |
| June 30, 2017 | 5.981M |
| May 31, 2017 | 6.238M |
| April 30, 2017 | 6.484M |
| March 31, 2017 | 6.381M |
| February 28, 2017 | 6.529M |
| January 31, 2017 | 6.564M |
| December 31, 2016 | 7.103M |
| November 30, 2016 | 7.058M |
| October 31, 2016 | 7.033M |
| September 30, 2016 | 7.181M |
| August 31, 2016 | 6.857M |
| Date | Value |
|---|---|
| July 31, 2016 | 7.102M |
| June 30, 2016 | 6.808M |
| May 31, 2016 | 7.004M |
| April 30, 2016 | 7.065M |
| March 31, 2016 | 6.979M |
| February 29, 2016 | 7.376M |
| January 31, 2016 | 7.460M |
| December 31, 2015 | 7.498M |
| November 30, 2015 | 7.792M |
| October 31, 2015 | 7.914M |
| September 30, 2015 | 7.896M |
| August 31, 2015 | 7.742M |
| July 31, 2015 | 7.814M |
| June 30, 2015 | 7.616M |
| May 31, 2015 | 8.027M |
| April 30, 2015 | 7.537M |
| March 31, 2015 | 7.760M |
| February 28, 2015 | 7.407M |
| January 31, 2015 | 7.670M |
| December 31, 2014 | 8.107M |
| November 30, 2014 | 8.140M |
| October 31, 2014 | 7.975M |
| September 30, 2014 | 7.788M |
| August 31, 2014 | 8.286M |
| July 31, 2014 | 7.971M |
News
Headline
Time (ET)
06/02 13:49
06/01 05:41
Basic Info
|
US Car Retail Sales is at a current level of 5.135M, down from 5.317M last month and down from 6.173M one year ago. This is a change of -3.42% from last month and -16.80% from one year ago. |
| Report | Motor Intelligence Light Vehicle Retail Sales |
| Category | Retail and Services Business Statistics |
| Region | United States |
| Source | Motor Intelligence |
Stats
| Last Value | 5.135M |
| Latest Period | Aug 2018 |
| Last Updated | Sep 6 2018, 13:39 EDT |
| Average Growth Rate | 2.95% |
| Value from Last Month | 5.317M |
| Change from Last Month | -3.42% |
| Value from 1 Year Ago | 6.173M |
| Change from 1 Year Ago | -16.80% |
| Frequency | Monthly |
| Adjustment | Seasonally Adjusted Annual Rate |
| Download Source File |