

US Automobile Imports from Mexico (I:USAIM)
122.92K for Mar 2026
Level Chart
Basic Info
|
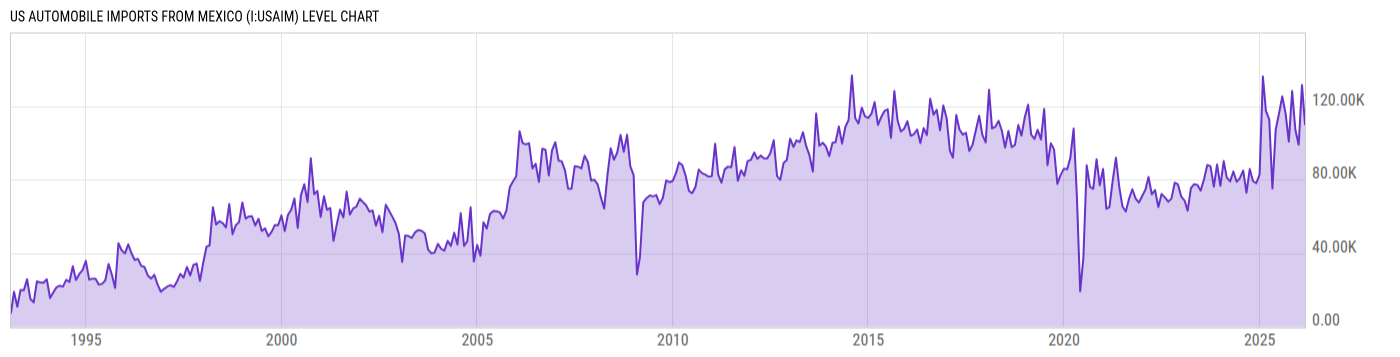
US Automobile Imports from Mexico is at a current level of 122.92K, up from 109.86K last month and up from 112.74K one year ago. This is a change of 11.89% from last month and 9.04% from one year ago. |
| Report | Supplemental Estimates |
| Category | Retail and Services Business Statistics |
| Region | United States |
| Source | Bureau of Economic Analysis |
Stats
| Last Value | 122.92K |
| Latest Period | Mar 2026 |
| Last Updated | May 28 2026, 10:01 EDT |
| Next Release | Jun 25 2026, 10:00 EDT |
| Average Growth Rate | 31.18% |
| Value from Last Month | 109.86K |
| Change from Last Month | 11.89% |
| Value from 1 Year Ago | 112.74K |
| Change from 1 Year Ago | 9.04% |
| Frequency | Monthly |
| Adjustment | Seasonally Adjusted |
| Download Source File |
Historical Data
| Date | Value |
|---|---|
| March 31, 2026 | 122.92K |
| February 28, 2026 | 109.86K |
| January 31, 2026 | 131.46K |
| December 31, 2025 | 98.91K |
| November 30, 2025 | 107.06K |
| October 31, 2025 | 128.13K |
| September 30, 2025 | 100.65K |
| August 31, 2025 | 115.88K |
| July 31, 2025 | 125.23K |
| June 30, 2025 | 115.76K |
| May 31, 2025 | 107.39K |
| April 30, 2025 | 75.11K |
| March 31, 2025 | 112.74K |
| February 28, 2025 | 117.39K |
| January 31, 2025 | 136.00K |
| December 31, 2024 | 82.66K |
| November 30, 2024 | 77.98K |
| October 31, 2024 | 79.05K |
| September 30, 2024 | 85.68K |
| August 31, 2024 | 72.80K |
| July 31, 2024 | 84.88K |
| June 30, 2024 | 80.79K |
| May 31, 2024 | 78.74K |
| April 30, 2024 | 84.33K |
| March 31, 2024 | 78.98K |
| Date | Value |
|---|---|
| February 29, 2024 | 81.04K |
| January 31, 2024 | 90.02K |
| December 31, 2023 | 76.55K |
| November 30, 2023 | 88.21K |
| October 31, 2023 | 76.11K |
| September 30, 2023 | 87.11K |
| August 31, 2023 | 87.94K |
| July 31, 2023 | 80.12K |
| June 30, 2023 | 73.94K |
| May 31, 2023 | 77.05K |
| April 30, 2023 | 77.46K |
| March 31, 2023 | 75.28K |
| February 28, 2023 | 62.95K |
| January 31, 2023 | 68.52K |
| December 31, 2022 | 70.64K |
| November 30, 2022 | 77.31K |
| October 31, 2022 | 78.26K |
| September 30, 2022 | 69.59K |
| August 31, 2022 | 67.95K |
| July 31, 2022 | 70.26K |
| June 30, 2022 | 72.14K |
| May 31, 2022 | 65.03K |
| April 30, 2022 | 74.23K |
| March 31, 2022 | 71.88K |
| February 28, 2022 | 81.35K |
News
Headline
Time (ET)
Basic Info
|
US Automobile Imports from Mexico is at a current level of 122.92K, up from 109.86K last month and up from 112.74K one year ago. This is a change of 11.89% from last month and 9.04% from one year ago. |
| Report | Supplemental Estimates |
| Category | Retail and Services Business Statistics |
| Region | United States |
| Source | Bureau of Economic Analysis |
Stats
| Last Value | 122.92K |
| Latest Period | Mar 2026 |
| Last Updated | May 28 2026, 10:01 EDT |
| Next Release | Jun 25 2026, 10:00 EDT |
| Average Growth Rate | 31.18% |
| Value from Last Month | 109.86K |
| Change from Last Month | 11.89% |
| Value from 1 Year Ago | 112.74K |
| Change from 1 Year Ago | 9.04% |
| Frequency | Monthly |
| Adjustment | Seasonally Adjusted |
| Download Source File |