

US Automobile Imports from Canada (I:USAIC)
39.58K for Mar 2026
Level Chart
Basic Info
|
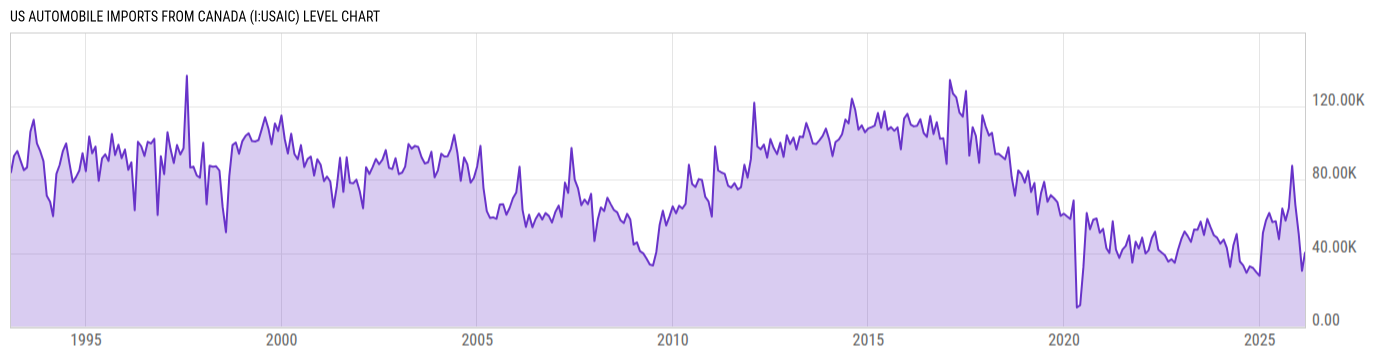
US Automobile Imports from Canada is at a current level of 39.58K, down from 40.07K last month and down from 61.80K one year ago. This is a change of -1.23% from last month and -35.96% from one year ago. |
| Report | Supplemental Estimates |
| Category | Retail and Services Business Statistics |
| Region | United States |
| Source | Bureau of Economic Analysis |
Stats
| Last Value | 39.58K |
| Latest Period | Mar 2026 |
| Last Updated | May 28 2026, 10:01 EDT |
| Next Release | Jun 25 2026, 10:00 EDT |
| Average Growth Rate | 16.59% |
| Value from Last Month | 40.07K |
| Change from Last Month | -1.23% |
| Value from 1 Year Ago | 61.80K |
| Change from 1 Year Ago | -35.96% |
| Frequency | Monthly |
| Adjustment | Seasonally Adjusted |
| Download Source File |
Historical Data
| Date | Value |
|---|---|
| March 31, 2026 | 39.58K |
| February 28, 2026 | 40.07K |
| January 31, 2026 | 30.33K |
| December 31, 2025 | 50.60K |
| November 30, 2025 | 66.21K |
| October 31, 2025 | 87.51K |
| September 30, 2025 | 64.51K |
| August 31, 2025 | 57.62K |
| July 31, 2025 | 64.18K |
| June 30, 2025 | 47.54K |
| May 31, 2025 | 57.31K |
| April 30, 2025 | 56.78K |
| March 31, 2025 | 61.80K |
| February 28, 2025 | 57.59K |
| January 31, 2025 | 50.84K |
| December 31, 2024 | 27.62K |
| November 30, 2024 | 29.60K |
| October 31, 2024 | 31.84K |
| September 30, 2024 | 32.72K |
| August 31, 2024 | 29.21K |
| July 31, 2024 | 33.29K |
| June 30, 2024 | 35.36K |
| May 31, 2024 | 50.30K |
| April 30, 2024 | 44.04K |
| March 31, 2024 | 32.44K |
| Date | Value |
|---|---|
| February 29, 2024 | 42.76K |
| January 31, 2024 | 47.29K |
| December 31, 2023 | 45.08K |
| November 30, 2023 | 48.38K |
| October 31, 2023 | 49.66K |
| September 30, 2023 | 54.02K |
| August 31, 2023 | 58.57K |
| July 31, 2023 | 49.79K |
| June 30, 2023 | 57.07K |
| May 31, 2023 | 52.62K |
| April 30, 2023 | 52.76K |
| March 31, 2023 | 46.05K |
| February 28, 2023 | 49.31K |
| January 31, 2023 | 51.72K |
| December 31, 2022 | 47.49K |
| November 30, 2022 | 41.65K |
| October 31, 2022 | 34.72K |
| September 30, 2022 | 36.64K |
| August 31, 2022 | 35.29K |
| July 31, 2022 | 38.80K |
| June 30, 2022 | 40.29K |
| May 31, 2022 | 41.80K |
| April 30, 2022 | 51.57K |
| March 31, 2022 | 48.12K |
| February 28, 2022 | 41.43K |
News
Headline
Time (ET)
Basic Info
|
US Automobile Imports from Canada is at a current level of 39.58K, down from 40.07K last month and down from 61.80K one year ago. This is a change of -1.23% from last month and -35.96% from one year ago. |
| Report | Supplemental Estimates |
| Category | Retail and Services Business Statistics |
| Region | United States |
| Source | Bureau of Economic Analysis |
Stats
| Last Value | 39.58K |
| Latest Period | Mar 2026 |
| Last Updated | May 28 2026, 10:01 EDT |
| Next Release | Jun 25 2026, 10:00 EDT |
| Average Growth Rate | 16.59% |
| Value from Last Month | 40.07K |
| Change from Last Month | -1.23% |
| Value from 1 Year Ago | 61.80K |
| Change from 1 Year Ago | -35.96% |
| Frequency | Monthly |
| Adjustment | Seasonally Adjusted |
| Download Source File |