

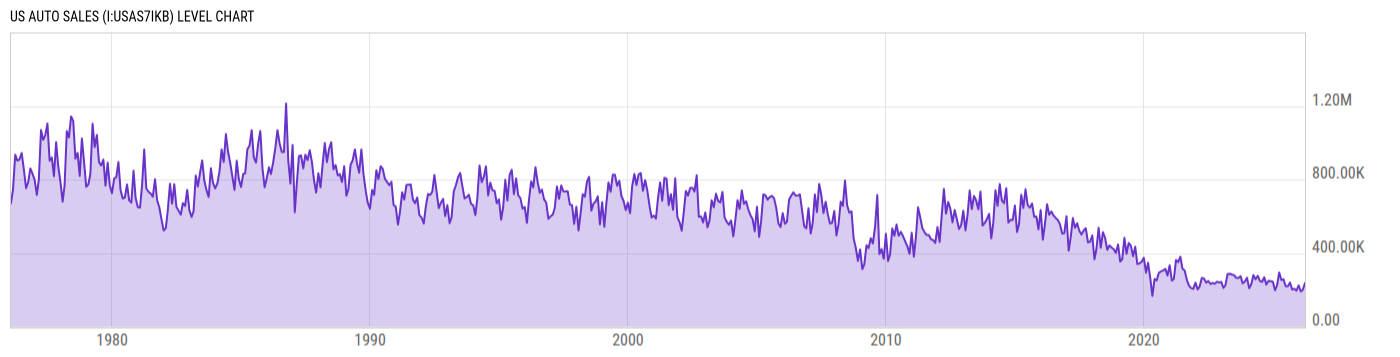
US Auto Sales (I:USAS7IKB)
236.58K for Apr 2026
Level Chart
Basic Info
|
US Auto Sales is at a current level of 236.58K, up from 231.66K last month and down from 253.36K one year ago. This is a change of 2.13% from last month and -6.62% from one year ago. |
| Report | Supplemental Estimates |
| Category | Retail and Services Business Statistics |
| Region | United States |
| Source | Bureau of Economic Analysis |
Stats
| Last Value | 236.58K |
| Latest Period | Apr 2026 |
| Last Updated | May 28 2026, 10:02 EDT |
| Next Release | Jun 25 2026, 10:00 EDT |
| Average Growth Rate | 9.18% |
| Value from Last Month | 231.66K |
| Change from Last Month | 2.13% |
| Value from 1 Year Ago | 253.36K |
| Change from 1 Year Ago | -6.62% |
| Frequency | Monthly |
| Adjustment | Not Seasonally Adjusted |
| Download Source File |
Historical Data
| Date | Value |
|---|---|
| April 30, 2026 | 236.58K |
| March 31, 2026 | 231.66K |
| February 28, 2026 | 190.68K |
| January 31, 2026 | 179.63K |
| December 31, 2025 | 223.48K |
| November 30, 2025 | 195.56K |
| October 31, 2025 | 205.58K |
| September 30, 2025 | 201.25K |
| August 31, 2025 | 239.41K |
| July 31, 2025 | 219.49K |
| June 30, 2025 | 219.10K |
| May 31, 2025 | 256.99K |
| April 30, 2025 | 253.36K |
| March 31, 2025 | 294.10K |
| February 28, 2025 | 223.45K |
| January 31, 2025 | 197.33K |
| December 31, 2024 | 243.50K |
| November 30, 2024 | 246.20K |
| October 31, 2024 | 249.03K |
| September 30, 2024 | 228.03K |
| August 31, 2024 | 267.88K |
| July 31, 2024 | 243.80K |
| June 30, 2024 | 247.66K |
| May 31, 2024 | 276.28K |
| April 30, 2024 | 256.74K |
| Date | Value |
|---|---|
| March 31, 2024 | 279.71K |
| February 29, 2024 | 230.28K |
| January 31, 2024 | 208.26K |
| December 31, 2023 | 264.90K |
| November 30, 2023 | 244.43K |
| October 31, 2023 | 234.87K |
| September 30, 2023 | 273.97K |
| August 31, 2023 | 263.59K |
| July 31, 2023 | 265.37K |
| June 30, 2023 | 279.08K |
| May 31, 2023 | 282.90K |
| April 30, 2023 | 287.36K |
| March 31, 2023 | 285.92K |
| February 28, 2023 | 224.01K |
| January 31, 2023 | 210.23K |
| December 31, 2022 | 242.91K |
| November 30, 2022 | 239.87K |
| October 31, 2022 | 243.54K |
| September 30, 2022 | 232.58K |
| August 31, 2022 | 237.70K |
| July 31, 2022 | 231.18K |
| June 30, 2022 | 247.88K |
| May 31, 2022 | 238.65K |
| April 30, 2022 | 261.06K |
| March 31, 2022 | 264.36K |
News
Headline
Time (ET)
Basic Info
|
US Auto Sales is at a current level of 236.58K, up from 231.66K last month and down from 253.36K one year ago. This is a change of 2.13% from last month and -6.62% from one year ago. |
| Report | Supplemental Estimates |
| Category | Retail and Services Business Statistics |
| Region | United States |
| Source | Bureau of Economic Analysis |
Stats
| Last Value | 236.58K |
| Latest Period | Apr 2026 |
| Last Updated | May 28 2026, 10:02 EDT |
| Next Release | Jun 25 2026, 10:00 EDT |
| Average Growth Rate | 9.18% |
| Value from Last Month | 231.66K |
| Change from Last Month | 2.13% |
| Value from 1 Year Ago | 253.36K |
| Change from 1 Year Ago | -6.62% |
| Frequency | Monthly |
| Adjustment | Not Seasonally Adjusted |
| Download Source File |