

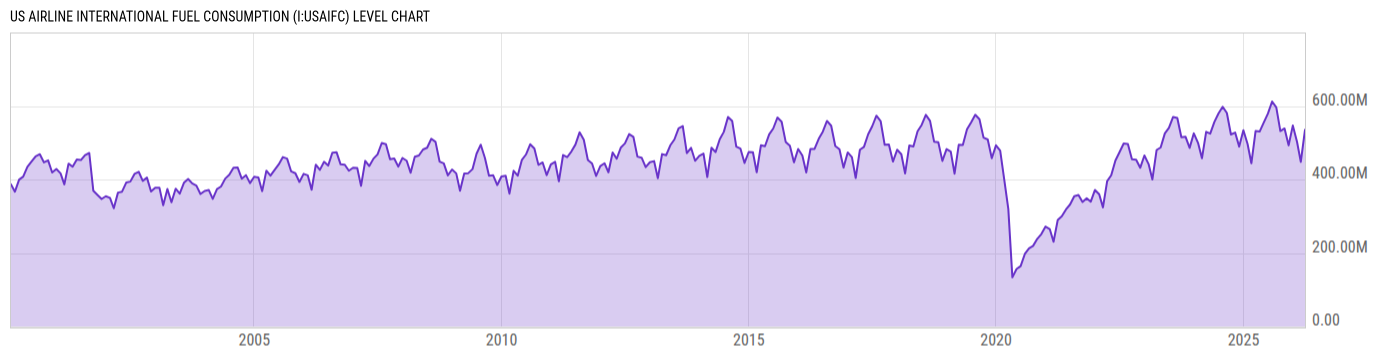
US Airline International Fuel Consumption (I:USAIFC)
535.20M gals for Mar 2026
Level Chart
Basic Info
|
US Airline International Fuel Consumption is at a current level of 535.20M, up from 447.80M last month and up from 531.80M one year ago. This is a change of 19.52% from last month and 0.64% from one year ago. |
| Report | US Airline Fuel Cost and Consumption |
| Category | Transportation |
| Region | United States |
| Source | Bureau of Transportation Statistics |
Stats
| Last Value | 535.20M |
| Latest Period | Mar 2026 |
| Last Updated | May 13 2026, 11:00 EDT |
| Next Release | Jun 10 2026, 11:00 EDT |
| Average Growth Rate | 6.04% |
| Value from Last Month | 447.80M |
| Change from Last Month | 19.52% |
| Value from 1 Year Ago | 531.80M |
| Change from 1 Year Ago | 0.64% |
| Frequency | Monthly |
| Unit | Gallons |
| Adjustment | Not Seasonally Adjusted |
| Download Source File |
Historical Data
| Date | Value |
|---|---|
| March 31, 2026 | 535.20M |
| February 28, 2026 | 447.80M |
| January 31, 2026 | 502.80M |
| December 31, 2025 | 546.70M |
| November 30, 2025 | 492.90M |
| October 31, 2025 | 538.90M |
| September 30, 2025 | 531.70M |
| August 31, 2025 | 596.30M |
| July 31, 2025 | 612.30M |
| June 30, 2025 | 579.20M |
| May 31, 2025 | 555.30M |
| April 30, 2025 | 530.40M |
| March 31, 2025 | 531.80M |
| February 28, 2025 | 444.20M |
| January 31, 2025 | 496.50M |
| December 31, 2024 | 534.00M |
| November 30, 2024 | 489.50M |
| October 31, 2024 | 527.80M |
| September 30, 2024 | 522.50M |
| August 31, 2024 | 580.80M |
| July 31, 2024 | 598.00M |
| June 30, 2024 | 579.60M |
| May 31, 2024 | 556.70M |
| April 30, 2024 | 524.80M |
| March 31, 2024 | 529.70M |
| Date | Value |
|---|---|
| February 29, 2024 | 457.70M |
| January 31, 2024 | 499.90M |
| December 31, 2023 | 525.60M |
| November 30, 2023 | 486.10M |
| October 31, 2023 | 516.20M |
| September 30, 2023 | 515.00M |
| August 31, 2023 | 567.20M |
| July 31, 2023 | 570.30M |
| June 30, 2023 | 540.20M |
| May 31, 2023 | 525.60M |
| April 30, 2023 | 487.10M |
| March 31, 2023 | 480.20M |
| February 28, 2023 | 400.10M |
| January 31, 2023 | 441.90M |
| December 31, 2022 | 465.30M |
| November 30, 2022 | 431.80M |
| October 31, 2022 | 453.70M |
| September 30, 2022 | 455.00M |
| August 31, 2022 | 496.50M |
| July 31, 2022 | 497.80M |
| June 30, 2022 | 474.10M |
| May 31, 2022 | 451.70M |
| April 30, 2022 | 411.50M |
| March 31, 2022 | 395.40M |
| February 28, 2022 | 324.20M |
News
Headline
Time (ET)
06/01 11:20
05/27 13:44
05/19 13:21
05/19 12:27
Basic Info
|
US Airline International Fuel Consumption is at a current level of 535.20M, up from 447.80M last month and up from 531.80M one year ago. This is a change of 19.52% from last month and 0.64% from one year ago. |
| Report | US Airline Fuel Cost and Consumption |
| Category | Transportation |
| Region | United States |
| Source | Bureau of Transportation Statistics |
Stats
| Last Value | 535.20M |
| Latest Period | Mar 2026 |
| Last Updated | May 13 2026, 11:00 EDT |
| Next Release | Jun 10 2026, 11:00 EDT |
| Average Growth Rate | 6.04% |
| Value from Last Month | 447.80M |
| Change from Last Month | 19.52% |
| Value from 1 Year Ago | 531.80M |
| Change from 1 Year Ago | 0.64% |
| Frequency | Monthly |
| Unit | Gallons |
| Adjustment | Not Seasonally Adjusted |
| Download Source File |