

US Airline Domestic Fuel Consumption (I:USADFC)
1.080B gals for Mar 2026
Level Chart
Basic Info
|
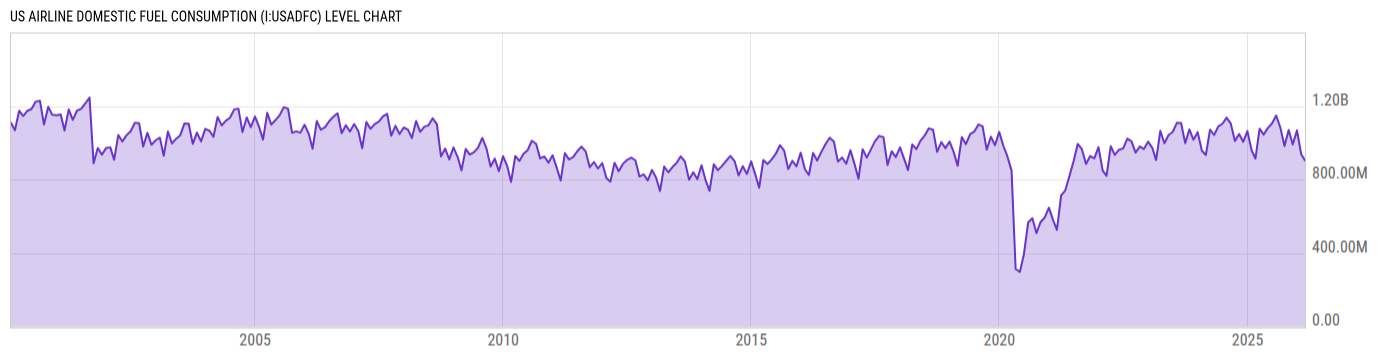
US Airline Domestic Fuel Consumption is at a current level of 1.080B, up from 904.10M last month and up from 1.077B one year ago. This is a change of 19.47% from last month and 0.32% from one year ago. |
| Report | US Airline Fuel Cost and Consumption |
| Category | Transportation |
| Region | United States |
| Source | Bureau of Transportation Statistics |
Stats
| Last Value | 1.080B |
| Latest Period | Mar 2026 |
| Last Updated | May 13 2026, 11:00 EDT |
| Next Release | Jun 10 2026, 11:00 EDT |
| Average Growth Rate | 5.18% |
| Value from Last Month | 904.10M |
| Change from Last Month | 19.47% |
| Value from 1 Year Ago | 1.077B |
| Change from 1 Year Ago | 0.32% |
| Frequency | Monthly |
| Unit | Gallons |
| Adjustment | Not Seasonally Adjusted |
| Download Source File |
Historical Data
| Date | Value |
|---|---|
| March 31, 2026 | 1.080B |
| February 28, 2026 | 904.10M |
| January 31, 2026 | 937.80M |
| December 31, 2025 | 1.068B |
| November 30, 2025 | 990.30M |
| October 31, 2025 | 1.069B |
| September 30, 2025 | 982.00M |
| August 31, 2025 | 1.081B |
| July 31, 2025 | 1.148B |
| June 30, 2025 | 1.105B |
| May 31, 2025 | 1.081B |
| April 30, 2025 | 1.044B |
| March 31, 2025 | 1.077B |
| February 28, 2025 | 914.10M |
| January 31, 2025 | 959.10M |
| December 31, 2024 | 1.063B |
| November 30, 2024 | 1.005B |
| October 31, 2024 | 1.048B |
| September 30, 2024 | 1.009B |
| August 31, 2024 | 1.104B |
| July 31, 2024 | 1.137B |
| June 30, 2024 | 1.103B |
| May 31, 2024 | 1.089B |
| April 30, 2024 | 1.042B |
| March 31, 2024 | 1.071B |
| Date | Value |
|---|---|
| February 29, 2024 | 933.50M |
| January 31, 2024 | 956.70M |
| December 31, 2023 | 1.058B |
| November 30, 2023 | 1.017B |
| October 31, 2023 | 1.072B |
| September 30, 2023 | 997.90M |
| August 31, 2023 | 1.107B |
| July 31, 2023 | 1.109B |
| June 30, 2023 | 1.059B |
| May 31, 2023 | 1.042B |
| April 30, 2023 | 997.20M |
| March 31, 2023 | 1.065B |
| February 28, 2023 | 905.60M |
| January 31, 2023 | 972.40M |
| December 31, 2022 | 1.006B |
| November 30, 2022 | 965.80M |
| October 31, 2022 | 979.80M |
| September 30, 2022 | 946.10M |
| August 31, 2022 | 1.007B |
| July 31, 2022 | 1.022B |
| June 30, 2022 | 968.60M |
| May 31, 2022 | 962.30M |
| April 30, 2022 | 933.70M |
| March 31, 2022 | 980.70M |
| February 28, 2022 | 820.00M |
News
Headline
Time (ET)
06/01 11:20
05/27 13:44
05/19 13:21
05/19 12:27
Basic Info
|
US Airline Domestic Fuel Consumption is at a current level of 1.080B, up from 904.10M last month and up from 1.077B one year ago. This is a change of 19.47% from last month and 0.32% from one year ago. |
| Report | US Airline Fuel Cost and Consumption |
| Category | Transportation |
| Region | United States |
| Source | Bureau of Transportation Statistics |
Stats
| Last Value | 1.080B |
| Latest Period | Mar 2026 |
| Last Updated | May 13 2026, 11:00 EDT |
| Next Release | Jun 10 2026, 11:00 EDT |
| Average Growth Rate | 5.18% |
| Value from Last Month | 904.10M |
| Change from Last Month | 19.47% |
| Value from 1 Year Ago | 1.077B |
| Change from 1 Year Ago | 0.32% |
| Frequency | Monthly |
| Unit | Gallons |
| Adjustment | Not Seasonally Adjusted |
| Download Source File |