

UnitedHealth Group Incorporated (UNH) - Products Revenue (I:UHGIUNNY)
Level Chart
Basic Info
|
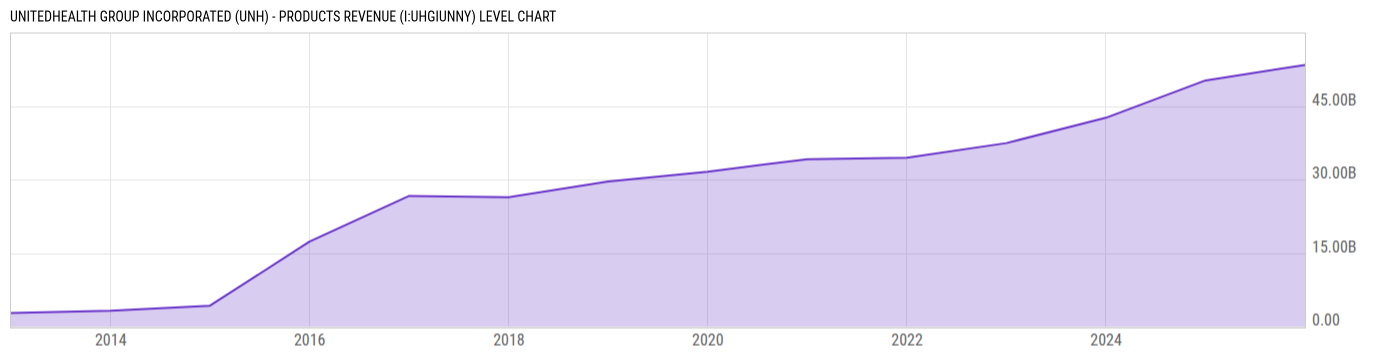
UnitedHealth Group Incorporated (UNH) - Products Revenue is at a current level of 53.38B, up from 50.23B one year ago. This is a change of 6.28% from one year ago. |
|
The majority of the company's revenue comes from its health services and health insurance operations, there are also some product-related revenue streams. Some of the key product categories include: Prescription Drugs, Medical Devices and Supplies, Healthcare Technology Solutions, Wellness and Health Products. |
| Report | Fiscal.ai |
| Category | Segments & KPIs |
| Region | United States |
| Source | Fiscal.ai |
|
Data provided via Fiscal.ai |
Stats
| Last Value | 53.38B |
| Latest Period | 2025 |
| Last Updated | Mar 23 2026, 14:15 EDT |
| Next Release | Feb 1 2027, 08:30 EST (E) |
| Average Growth Rate | 37.20% |
| Value from 1 Year Ago | 50.23B |
| Change from 1 Year Ago | 6.28% |
| Frequency | Yearly |
| Unit | USD |
| Adjustment | N/A |
| Download Source File |
Historical Data
| Date | Value |
|---|---|
| December 31, 2025 | 53.38B |
| December 31, 2024 | 50.23B |
| December 31, 2023 | 42.58B |
| December 31, 2022 | 37.42B |
| December 31, 2021 | 34.44B |
| December 31, 2020 | 34.14B |
| December 31, 2019 | 31.60B |
| Date | Value |
|---|---|
| December 31, 2018 | 29.60B |
| December 31, 2017 | 26.37B |
| December 31, 2016 | 26.66B |
| December 31, 2015 | 17.31B |
| December 31, 2014 | 4.242B |
| December 31, 2013 | 3.19B |
| December 31, 2012 | 2.773B |
News
Basic Info
|
UnitedHealth Group Incorporated (UNH) - Products Revenue is at a current level of 53.38B, up from 50.23B one year ago. This is a change of 6.28% from one year ago. |
|
The majority of the company's revenue comes from its health services and health insurance operations, there are also some product-related revenue streams. Some of the key product categories include: Prescription Drugs, Medical Devices and Supplies, Healthcare Technology Solutions, Wellness and Health Products. |
| Report | Fiscal.ai |
| Category | Segments & KPIs |
| Region | United States |
| Source | Fiscal.ai |
|
Data provided via Fiscal.ai |
Stats
| Last Value | 53.38B |
| Latest Period | 2025 |
| Last Updated | Mar 23 2026, 14:15 EDT |
| Next Release | Feb 1 2027, 08:30 EST (E) |
| Average Growth Rate | 37.20% |
| Value from 1 Year Ago | 50.23B |
| Change from 1 Year Ago | 6.28% |
| Frequency | Yearly |
| Unit | USD |
| Adjustment | N/A |
| Download Source File |