

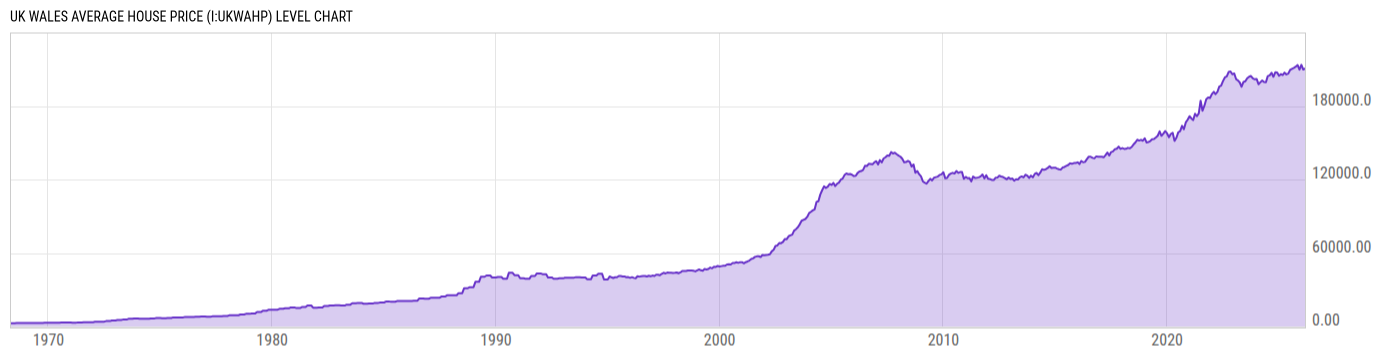
UK Wales Average House Price (I:UKWAHP)
213240.0 GBP for Mar 2026
Level Chart
Basic Info
|
UK Wales Average House Price is at a current level of 213240.0, up from 211968.0 last month and up from 207151.0 one year ago. This is a change of 0.60% from last month and 2.94% from one year ago. |
| Report | UK House Price Index |
| Category | House Prices |
| Region | United Kingdom |
| Source | Office for National Statistics |
Stats
| Last Value | 213240.0 |
| Latest Period | Mar 2026 |
| Last Updated | May 20 2026, 04:31 EDT |
| Next Release | Jun 17 2026, 04:30 EDT |
| Average Growth Rate | 7.87% |
| Value from Last Month | 211968.0 |
| Change from Last Month | 0.60% |
| Value from 1 Year Ago | 207151.0 |
| Change from 1 Year Ago | 2.94% |
| Frequency | Monthly |
| Unit | GBP |
| Adjustment | Not Seasonally Adjusted |
| Download Source File |
Historical Data
| Date | Value |
|---|---|
| March 31, 2026 | 213240.0 |
| February 28, 2026 | 211968.0 |
| January 31, 2026 | 210050.0 |
| December 31, 2025 | 213752.0 |
| November 30, 2025 | 210429.0 |
| October 31, 2025 | 213226.0 |
| September 30, 2025 | 211641.0 |
| August 31, 2025 | 210458.0 |
| July 31, 2025 | 209139.0 |
| June 30, 2025 | 208463.0 |
| May 31, 2025 | 206158.0 |
| April 30, 2025 | 205297.0 |
| March 31, 2025 | 207151.0 |
| February 28, 2025 | 205266.0 |
| January 31, 2025 | 206010.0 |
| December 31, 2024 | 204641.0 |
| November 30, 2024 | 207435.0 |
| October 31, 2024 | 207454.0 |
| September 30, 2024 | 203822.0 |
| August 31, 2024 | 207156.0 |
| July 31, 2024 | 204982.0 |
| June 30, 2024 | 204368.0 |
| May 31, 2024 | 199330.0 |
| April 30, 2024 | 199545.0 |
| March 31, 2024 | 200795.0 |
| Date | Value |
|---|---|
| February 29, 2024 | 199272.0 |
| January 31, 2024 | 197808.0 |
| December 31, 2023 | 202077.0 |
| November 30, 2023 | 201778.0 |
| October 31, 2023 | 202477.0 |
| September 30, 2023 | 204460.0 |
| August 31, 2023 | 203852.0 |
| July 31, 2023 | 202620.0 |
| June 30, 2023 | 200183.0 |
| May 31, 2023 | 199616.0 |
| April 30, 2023 | 195717.0 |
| March 31, 2023 | 199167.0 |
| February 28, 2023 | 200870.0 |
| January 31, 2023 | 201853.0 |
| December 31, 2022 | 206563.0 |
| November 30, 2022 | 205941.0 |
| October 31, 2022 | 208209.0 |
| September 30, 2022 | 207696.0 |
| August 31, 2022 | 204218.0 |
| July 31, 2022 | 203313.0 |
| June 30, 2022 | 200277.0 |
| May 31, 2022 | 196682.0 |
| April 30, 2022 | 195875.0 |
| March 31, 2022 | 191471.0 |
| February 28, 2022 | 189656.0 |
News
Headline
Time (ET)
05/15 07:05
05/14 07:24
Basic Info
|
UK Wales Average House Price is at a current level of 213240.0, up from 211968.0 last month and up from 207151.0 one year ago. This is a change of 0.60% from last month and 2.94% from one year ago. |
| Report | UK House Price Index |
| Category | House Prices |
| Region | United Kingdom |
| Source | Office for National Statistics |
Stats
| Last Value | 213240.0 |
| Latest Period | Mar 2026 |
| Last Updated | May 20 2026, 04:31 EDT |
| Next Release | Jun 17 2026, 04:30 EDT |
| Average Growth Rate | 7.87% |
| Value from Last Month | 211968.0 |
| Change from Last Month | 0.60% |
| Value from 1 Year Ago | 207151.0 |
| Change from 1 Year Ago | 2.94% |
| Frequency | Monthly |
| Unit | GBP |
| Adjustment | Not Seasonally Adjusted |
| Download Source File |