

UK Scotland Average House Price (I:UKSAHP)
186582.0 GBP for Mar 2026
Level Chart
Basic Info
|
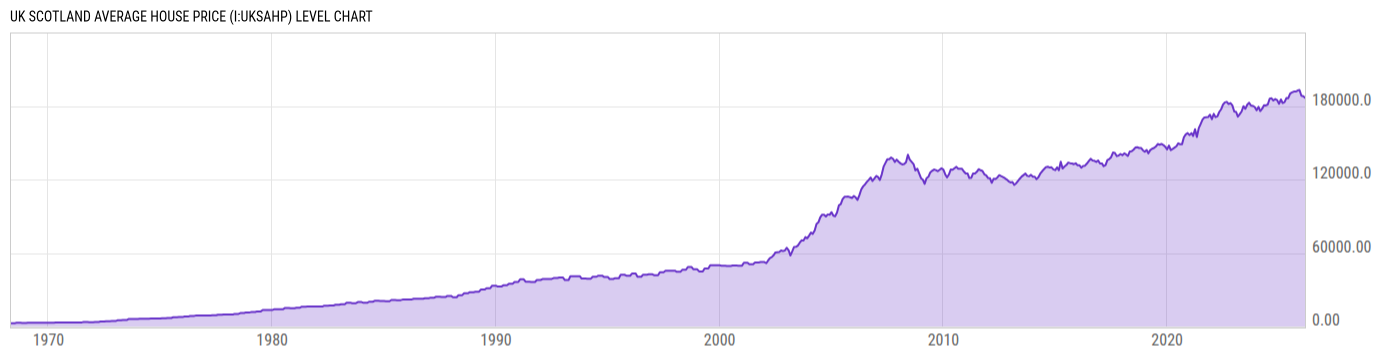
UK Scotland Average House Price is at a current level of 186582.0, down from 187012.0 last month and up from 183642.0 one year ago. This is a change of -0.23% from last month and 1.60% from one year ago. |
| Report | UK House Price Index |
| Category | House Prices |
| Region | United Kingdom |
| Source | Office for National Statistics |
Stats
| Last Value | 186582.0 |
| Latest Period | Mar 2026 |
| Last Updated | May 20 2026, 04:31 EDT |
| Next Release | Jun 17 2026, 04:30 EDT |
| Average Growth Rate | 7.61% |
| Value from Last Month | 187012.0 |
| Change from Last Month | -0.23% |
| Value from 1 Year Ago | 183642.0 |
| Change from 1 Year Ago | 1.60% |
| Frequency | Monthly |
| Unit | GBP |
| Adjustment | Not Seasonally Adjusted |
| Download Source File |
Historical Data
| Date | Value |
|---|---|
| March 31, 2026 | 186582.0 |
| February 28, 2026 | 187012.0 |
| January 31, 2026 | 187723.0 |
| December 31, 2025 | 188107.0 |
| November 30, 2025 | 192520.0 |
| October 31, 2025 | 192672.0 |
| September 30, 2025 | 192623.0 |
| August 31, 2025 | 192101.0 |
| July 31, 2025 | 190879.0 |
| June 30, 2025 | 190624.0 |
| May 31, 2025 | 186486.0 |
| April 30, 2025 | 186801.0 |
| March 31, 2025 | 183642.0 |
| February 28, 2025 | 182421.0 |
| January 31, 2025 | 185315.0 |
| December 31, 2024 | 181800.0 |
| November 30, 2024 | 184775.0 |
| October 31, 2024 | 185664.0 |
| September 30, 2024 | 184496.0 |
| August 31, 2024 | 186285.0 |
| July 31, 2024 | 185882.0 |
| June 30, 2024 | 181219.0 |
| May 31, 2024 | 180418.0 |
| April 30, 2024 | 180647.0 |
| March 31, 2024 | 177778.0 |
| Date | Value |
|---|---|
| February 29, 2024 | 175883.0 |
| January 31, 2024 | 179248.0 |
| December 31, 2023 | 176538.0 |
| November 30, 2023 | 179184.0 |
| October 31, 2023 | 180051.0 |
| September 30, 2023 | 180364.0 |
| August 31, 2023 | 182593.0 |
| July 31, 2023 | 181013.0 |
| June 30, 2023 | 177705.0 |
| May 31, 2023 | 179854.0 |
| April 30, 2023 | 175512.0 |
| March 31, 2023 | 173352.0 |
| February 28, 2023 | 171282.0 |
| January 31, 2023 | 175092.0 |
| December 31, 2022 | 175560.0 |
| November 30, 2022 | 180523.0 |
| October 31, 2022 | 182341.0 |
| September 30, 2022 | 181639.0 |
| August 31, 2022 | 183378.0 |
| July 31, 2022 | 182979.0 |
| June 30, 2022 | 181120.0 |
| May 31, 2022 | 177326.0 |
| April 30, 2022 | 175109.0 |
| March 31, 2022 | 171510.0 |
| February 28, 2022 | 170905.0 |
News
Headline
Time (ET)
05/15 07:05
05/14 07:24
Basic Info
|
UK Scotland Average House Price is at a current level of 186582.0, down from 187012.0 last month and up from 183642.0 one year ago. This is a change of -0.23% from last month and 1.60% from one year ago. |
| Report | UK House Price Index |
| Category | House Prices |
| Region | United Kingdom |
| Source | Office for National Statistics |
Stats
| Last Value | 186582.0 |
| Latest Period | Mar 2026 |
| Last Updated | May 20 2026, 04:31 EDT |
| Next Release | Jun 17 2026, 04:30 EDT |
| Average Growth Rate | 7.61% |
| Value from Last Month | 187012.0 |
| Change from Last Month | -0.23% |
| Value from 1 Year Ago | 183642.0 |
| Change from 1 Year Ago | 1.60% |
| Frequency | Monthly |
| Unit | GBP |
| Adjustment | Not Seasonally Adjusted |
| Download Source File |