

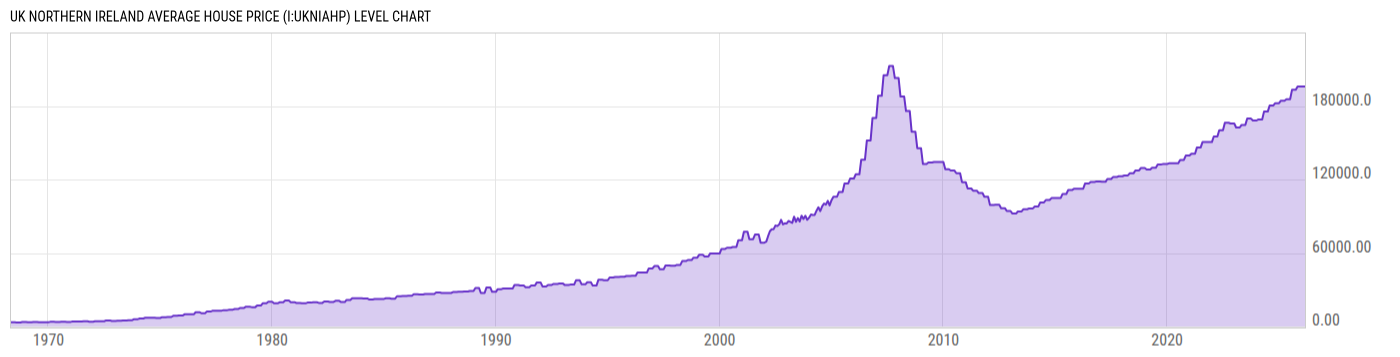
UK Northern Ireland Average House Price (I:UKNIAHP)
198015.0 GBP for Mar 2026
Level Chart
Basic Info
|
UK Northern Ireland Average House Price is at a current level of 198015.0, unchanged from 198015.0 last month and up from 184322.0 one year ago. This is a change of 0.00% from last month and 7.43% from one year ago. |
| Report | UK House Price Index |
| Category | House Prices |
| Region | United Kingdom |
| Source | Office for National Statistics |
Stats
| Last Value | 198015.0 |
| Latest Period | Mar 2026 |
| Last Updated | May 20 2026, 04:31 EDT |
| Next Release | Jun 17 2026, 04:30 EDT |
| Average Growth Rate | 7.59% |
| Value from Last Month | 198015.0 |
| Change from Last Month | 0.00% |
| Value from 1 Year Ago | 184322.0 |
| Change from 1 Year Ago | 7.43% |
| Frequency | Monthly |
| Unit | GBP |
| Adjustment | Not Seasonally Adjusted |
| Download Source File |
Historical Data
| Date | Value |
|---|---|
| March 31, 2026 | 198015.0 |
| February 28, 2026 | 198015.0 |
| January 31, 2026 | 198015.0 |
| December 31, 2025 | 195111.0 |
| November 30, 2025 | 195111.0 |
| October 31, 2025 | 195111.0 |
| September 30, 2025 | 193080.0 |
| August 31, 2025 | 193080.0 |
| July 31, 2025 | 193080.0 |
| June 30, 2025 | 185455.0 |
| May 31, 2025 | 185455.0 |
| April 30, 2025 | 185455.0 |
| March 31, 2025 | 184322.0 |
| February 28, 2025 | 184322.0 |
| January 31, 2025 | 184322.0 |
| December 31, 2024 | 182320.0 |
| November 30, 2024 | 182320.0 |
| October 31, 2024 | 182320.0 |
| September 30, 2024 | 180467.0 |
| August 31, 2024 | 180467.0 |
| July 31, 2024 | 180467.0 |
| June 30, 2024 | 175418.0 |
| May 31, 2024 | 175418.0 |
| April 30, 2024 | 175418.0 |
| March 31, 2024 | 169060.0 |
| Date | Value |
|---|---|
| February 29, 2024 | 169060.0 |
| January 31, 2024 | 169060.0 |
| December 31, 2023 | 168157.0 |
| November 30, 2023 | 168157.0 |
| October 31, 2023 | 168157.0 |
| September 30, 2023 | 169726.0 |
| August 31, 2023 | 169726.0 |
| July 31, 2023 | 169726.0 |
| June 30, 2023 | 164587.0 |
| May 31, 2023 | 164587.0 |
| April 30, 2023 | 164587.0 |
| March 31, 2023 | 162479.0 |
| February 28, 2023 | 162479.0 |
| January 31, 2023 | 162479.0 |
| December 31, 2022 | 165729.0 |
| November 30, 2022 | 165729.0 |
| October 31, 2022 | 165729.0 |
| September 30, 2022 | 166363.0 |
| August 31, 2022 | 166363.0 |
| July 31, 2022 | 166363.0 |
| June 30, 2022 | 160214.0 |
| May 31, 2022 | 160214.0 |
| April 30, 2022 | 160214.0 |
| March 31, 2022 | 155086.0 |
| February 28, 2022 | 155086.0 |
News
Headline
Time (ET)
05/15 07:05
05/14 07:24
Basic Info
|
UK Northern Ireland Average House Price is at a current level of 198015.0, unchanged from 198015.0 last month and up from 184322.0 one year ago. This is a change of 0.00% from last month and 7.43% from one year ago. |
| Report | UK House Price Index |
| Category | House Prices |
| Region | United Kingdom |
| Source | Office for National Statistics |
Stats
| Last Value | 198015.0 |
| Latest Period | Mar 2026 |
| Last Updated | May 20 2026, 04:31 EDT |
| Next Release | Jun 17 2026, 04:30 EDT |
| Average Growth Rate | 7.59% |
| Value from Last Month | 198015.0 |
| Change from Last Month | 0.00% |
| Value from 1 Year Ago | 184322.0 |
| Change from 1 Year Ago | 7.43% |
| Frequency | Monthly |
| Unit | GBP |
| Adjustment | Not Seasonally Adjusted |
| Download Source File |