

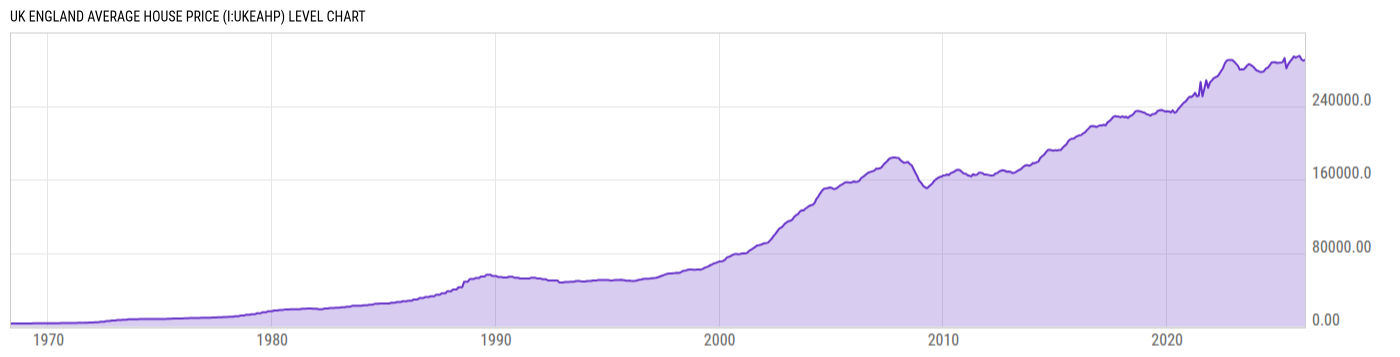
UK England Average House Price (I:UKEAHP)
289946.0 GBP for Mar 2026
Level Chart
Basic Info
|
UK England Average House Price is at a current level of 289946.0, down from 291360.0 last month and down from 291748.0 one year ago. This is a change of -0.49% from last month and -0.62% from one year ago. |
| Report | UK House Price Index |
| Category | House Prices |
| Region | United Kingdom |
| Source | Office for National Statistics |
Stats
| Last Value | 289946.0 |
| Latest Period | Mar 2026 |
| Last Updated | May 20 2026, 04:31 EDT |
| Next Release | Jun 17 2026, 04:30 EDT |
| Average Growth Rate | 7.97% |
| Value from Last Month | 291360.0 |
| Change from Last Month | -0.49% |
| Value from 1 Year Ago | 291748.0 |
| Change from 1 Year Ago | -0.62% |
| Frequency | Monthly |
| Unit | GBP |
| Adjustment | Not Seasonally Adjusted |
| Download Source File |
Historical Data
| Date | Value |
|---|---|
| March 31, 2026 | 289946.0 |
| February 28, 2026 | 291360.0 |
| January 31, 2026 | 289535.0 |
| December 31, 2025 | 290075.0 |
| November 30, 2025 | 293509.0 |
| October 31, 2025 | 293213.0 |
| September 30, 2025 | 292320.0 |
| August 31, 2025 | 293676.0 |
| July 31, 2025 | 290139.0 |
| June 30, 2025 | 287881.0 |
| May 31, 2025 | 285545.0 |
| April 30, 2025 | 280652.0 |
| March 31, 2025 | 291748.0 |
| February 28, 2025 | 287794.0 |
| January 31, 2025 | 287264.0 |
| December 31, 2024 | 287035.0 |
| November 30, 2024 | 286814.0 |
| October 31, 2024 | 287595.0 |
| September 30, 2024 | 287576.0 |
| August 31, 2024 | 287343.0 |
| July 31, 2024 | 284105.0 |
| June 30, 2024 | 281611.0 |
| May 31, 2024 | 280824.0 |
| April 30, 2024 | 277945.0 |
| March 31, 2024 | 276971.0 |
| Date | Value |
|---|---|
| February 29, 2024 | 276935.0 |
| January 31, 2024 | 278060.0 |
| December 31, 2023 | 278664.0 |
| November 30, 2023 | 281026.0 |
| October 31, 2023 | 283147.0 |
| September 30, 2023 | 284428.0 |
| August 31, 2023 | 285690.0 |
| July 31, 2023 | 284246.0 |
| June 30, 2023 | 281585.0 |
| May 31, 2023 | 279846.0 |
| April 30, 2023 | 280054.0 |
| March 31, 2023 | 279592.0 |
| February 28, 2023 | 283907.0 |
| January 31, 2023 | 285817.0 |
| December 31, 2022 | 288198.0 |
| November 30, 2022 | 290003.0 |
| October 31, 2022 | 289993.0 |
| September 30, 2022 | 290185.0 |
| August 31, 2022 | 289294.0 |
| July 31, 2022 | 286526.0 |
| June 30, 2022 | 281116.0 |
| May 31, 2022 | 278084.0 |
| April 30, 2022 | 274812.0 |
| March 31, 2022 | 272225.0 |
| February 28, 2022 | 271265.0 |
News
Headline
Time (ET)
05/15 07:05
05/14 07:24
Basic Info
|
UK England Average House Price is at a current level of 289946.0, down from 291360.0 last month and down from 291748.0 one year ago. This is a change of -0.49% from last month and -0.62% from one year ago. |
| Report | UK House Price Index |
| Category | House Prices |
| Region | United Kingdom |
| Source | Office for National Statistics |
Stats
| Last Value | 289946.0 |
| Latest Period | Mar 2026 |
| Last Updated | May 20 2026, 04:31 EDT |
| Next Release | Jun 17 2026, 04:30 EDT |
| Average Growth Rate | 7.97% |
| Value from Last Month | 291360.0 |
| Change from Last Month | -0.49% |
| Value from 1 Year Ago | 291748.0 |
| Change from 1 Year Ago | -0.62% |
| Frequency | Monthly |
| Unit | GBP |
| Adjustment | Not Seasonally Adjusted |
| Download Source File |