

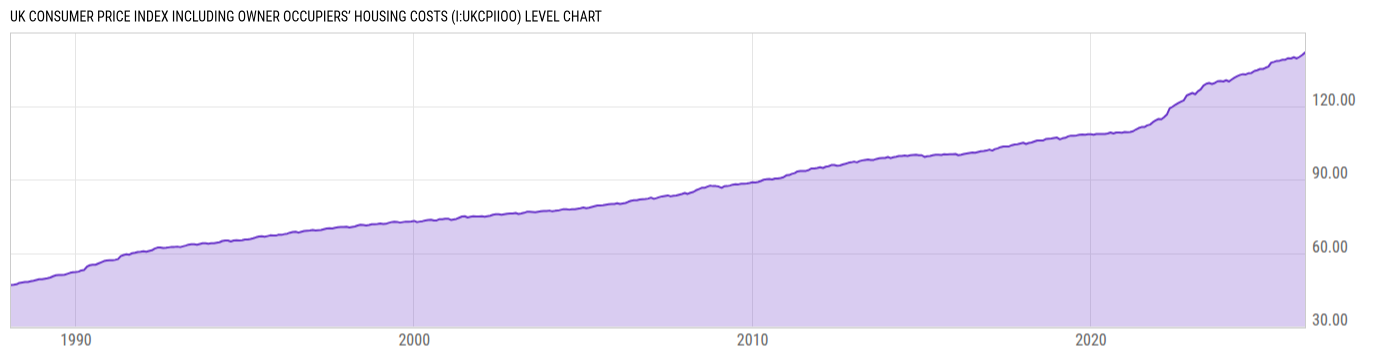
UK Consumer Price Index Including Owner Occupiers’ Housing Costs (I:UKCPIIOO)
141.80 for Apr 2026
Level Chart
Basic Info
|
UK Consumer Price Index Including Owner Occupiers’ Housing Costs is at a current level of 141.80, up from 140.80 last month and up from 137.70 one year ago. This is a change of 0.71% from last month and 2.98% from one year ago. |
| Report | UK Consumer Price Index |
| Category | Consumer Prices |
| Region | United Kingdom |
| Source | Office for National Statistics |
Stats
| Last Value | 141.80 |
| Latest Period | Apr 2026 |
| Last Updated | May 20 2026, 04:31 EDT |
| Next Release | Jun 17 2026, 04:30 EDT |
| Average Growth Rate | 2.90% |
| Value from Last Month | 140.80 |
| Change from Last Month | 0.71% |
| Value from 1 Year Ago | 137.70 |
| Change from 1 Year Ago | 2.98% |
| Frequency | Monthly |
| Unit | Index 2015=100 |
| Adjustment | Not Seasonally Adjusted |
| Download Source File |
Historical Data
| Date | Value |
|---|---|
| April 30, 2026 | 141.80 |
| March 31, 2026 | 140.80 |
| February 28, 2026 | 140.00 |
| January 31, 2026 | 139.40 |
| December 31, 2025 | 139.90 |
| November 30, 2025 | 139.40 |
| October 31, 2025 | 139.50 |
| September 30, 2025 | 138.90 |
| August 31, 2025 | 138.90 |
| July 31, 2025 | 138.50 |
| June 30, 2025 | 138.40 |
| May 31, 2025 | 138.00 |
| April 30, 2025 | 137.70 |
| March 31, 2025 | 136.10 |
| February 28, 2025 | 135.60 |
| January 31, 2025 | 135.10 |
| December 31, 2024 | 135.10 |
| November 30, 2024 | 134.60 |
| October 31, 2024 | 134.30 |
| September 30, 2024 | 133.50 |
| August 31, 2024 | 133.40 |
| July 31, 2024 | 132.90 |
| June 30, 2024 | 133.00 |
| May 31, 2024 | 132.70 |
| April 30, 2024 | 132.20 |
| Date | Value |
|---|---|
| March 31, 2024 | 131.60 |
| February 29, 2024 | 130.80 |
| January 31, 2024 | 130.00 |
| December 31, 2023 | 130.50 |
| November 30, 2023 | 130.00 |
| October 31, 2023 | 130.20 |
| September 30, 2023 | 130.10 |
| August 31, 2023 | 129.40 |
| July 31, 2023 | 129.00 |
| June 30, 2023 | 129.40 |
| May 31, 2023 | 129.10 |
| April 30, 2023 | 128.30 |
| March 31, 2023 | 126.80 |
| February 28, 2023 | 126.00 |
| January 31, 2023 | 124.80 |
| December 31, 2022 | 125.30 |
| November 30, 2022 | 124.80 |
| October 31, 2022 | 124.30 |
| September 30, 2022 | 122.30 |
| August 31, 2022 | 121.80 |
| July 31, 2022 | 121.20 |
| June 30, 2022 | 120.50 |
| May 31, 2022 | 119.70 |
| April 30, 2022 | 119.00 |
| March 31, 2022 | 116.50 |
News
Headline
Time (ET)
05/22 07:41
05/14 06:14
Basic Info
|
UK Consumer Price Index Including Owner Occupiers’ Housing Costs is at a current level of 141.80, up from 140.80 last month and up from 137.70 one year ago. This is a change of 0.71% from last month and 2.98% from one year ago. |
| Report | UK Consumer Price Index |
| Category | Consumer Prices |
| Region | United Kingdom |
| Source | Office for National Statistics |
Stats
| Last Value | 141.80 |
| Latest Period | Apr 2026 |
| Last Updated | May 20 2026, 04:31 EDT |
| Next Release | Jun 17 2026, 04:30 EDT |
| Average Growth Rate | 2.90% |
| Value from Last Month | 140.80 |
| Change from Last Month | 0.71% |
| Value from 1 Year Ago | 137.70 |
| Change from 1 Year Ago | 2.98% |
| Frequency | Monthly |
| Unit | Index 2015=100 |
| Adjustment | Not Seasonally Adjusted |
| Download Source File |