

UK House Price Index YoY (I:UKCUKHPI)
0.10% for Mar 2026
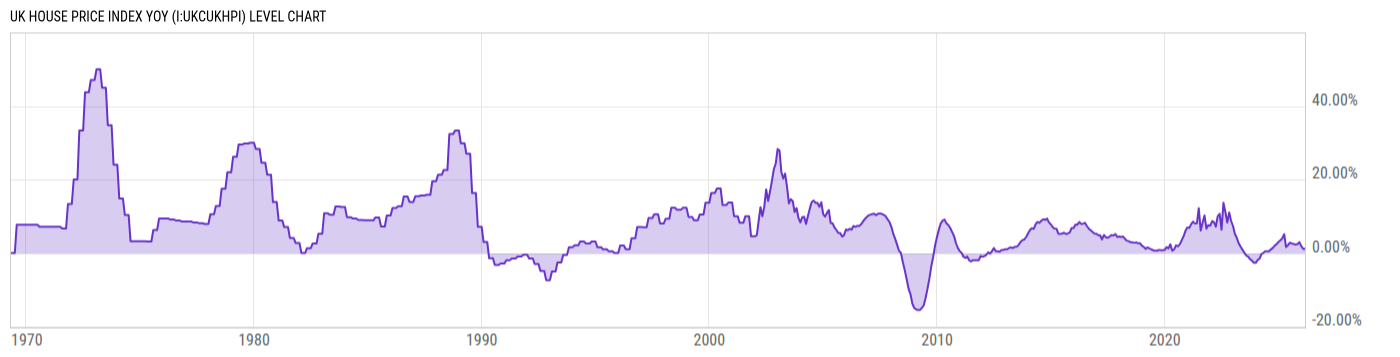
Level Chart
Basic Info
|
UK House Price Index YoY is at 0.10%, compared to 1.67% last month and 5.01% last year. This is lower than the long term average of 8.38%. |
| Report | UK House Price Index |
| Category | House Prices |
| Region | United Kingdom |
| Source | Office for National Statistics |
Stats
| Last Value | 0.10% |
| Latest Period | Mar 2026 |
| Last Updated | May 20 2026, 04:31 EDT |
| Next Release | Jun 17 2026, 04:30 EDT |
| Long Term Average | 8.38% |
| Average Growth Rate | -20.75% |
| Value from Last Month | 1.67% |
| Change from Last Month | -94.18% |
| Value from 1 Year Ago | 5.01% |
| Change from 1 Year Ago | -98.06% |
| Frequency | Monthly |
| Unit | Percent |
| Adjustment | Not Seasonally Adjusted |
| Download Source File |
Historical Data
| Date | Value |
|---|---|
| March 31, 2026 | 0.10% |
| February 28, 2026 | 1.67% |
| January 31, 2026 | 1.08% |
| December 31, 2025 | 1.68% |
| November 30, 2025 | 2.66% |
| October 31, 2025 | 2.26% |
| September 30, 2025 | 2.17% |
| August 31, 2025 | 2.36% |
| July 31, 2025 | 2.29% |
| June 30, 2025 | 2.61% |
| May 31, 2025 | 2.02% |
| April 30, 2025 | 1.42% |
| March 31, 2025 | 5.01% |
| February 28, 2025 | 4.00% |
| January 31, 2025 | 3.47% |
| December 31, 2024 | 3.06% |
| November 30, 2024 | 2.42% |
| October 31, 2024 | 2.01% |
| September 30, 2024 | 1.40% |
| August 31, 2024 | 0.99% |
| July 31, 2024 | 0.50% |
| June 30, 2024 | 0.51% |
| May 31, 2024 | 0.51% |
| April 30, 2024 | 0.00% |
| March 31, 2024 | -0.31% |
| Date | Value |
|---|---|
| February 29, 2024 | -1.61% |
| January 31, 2024 | -1.90% |
| December 31, 2023 | -2.68% |
| November 30, 2023 | -2.65% |
| October 31, 2023 | -2.06% |
| September 30, 2023 | -1.67% |
| August 31, 2023 | -0.98% |
| July 31, 2023 | -0.69% |
| June 30, 2023 | 0.10% |
| May 31, 2023 | 0.92% |
| April 30, 2023 | 1.76% |
| March 31, 2023 | 2.72% |
| February 28, 2023 | 4.20% |
| January 31, 2023 | 5.15% |
| December 31, 2022 | 7.34% |
| November 30, 2022 | 8.77% |
| October 31, 2022 | 11.01% |
| September 30, 2022 | 8.30% |
| August 31, 2022 | 11.16% |
| July 31, 2022 | 13.64% |
| June 30, 2022 | 6.34% |
| May 31, 2022 | 10.65% |
| April 30, 2022 | 10.02% |
| March 31, 2022 | 7.18% |
| February 28, 2022 | 8.43% |
News
Headline
Time (ET)
05/15 07:05
05/14 07:24
Basic Info
|
UK House Price Index YoY is at 0.10%, compared to 1.67% last month and 5.01% last year. This is lower than the long term average of 8.38%. |
| Report | UK House Price Index |
| Category | House Prices |
| Region | United Kingdom |
| Source | Office for National Statistics |
Stats
| Last Value | 0.10% |
| Latest Period | Mar 2026 |
| Last Updated | May 20 2026, 04:31 EDT |
| Next Release | Jun 17 2026, 04:30 EDT |
| Long Term Average | 8.38% |
| Average Growth Rate | -20.75% |
| Value from Last Month | 1.67% |
| Change from Last Month | -94.18% |
| Value from 1 Year Ago | 5.01% |
| Change from 1 Year Ago | -98.06% |
| Frequency | Monthly |
| Unit | Percent |
| Adjustment | Not Seasonally Adjusted |
| Download Source File |