

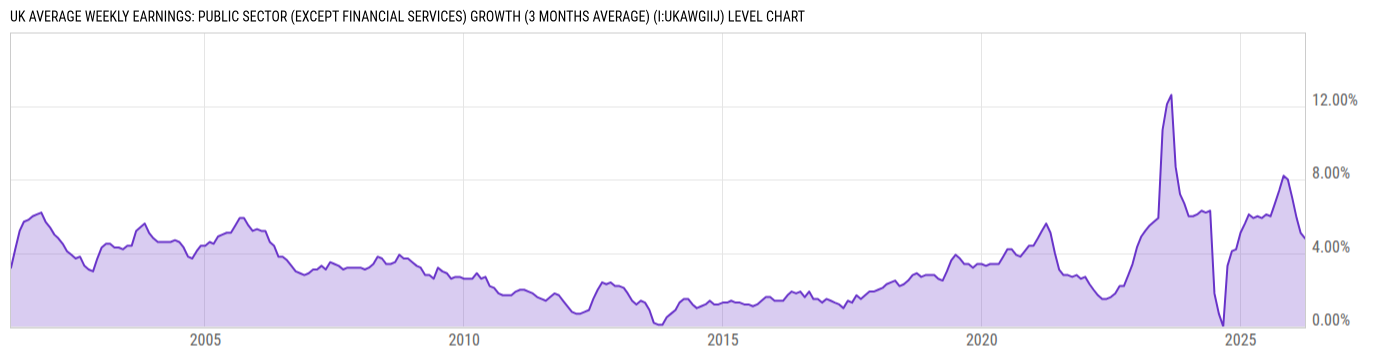
UK Average Weekly Earnings: Public Sector (except Financial Services) Growth (3 Months Average) (I:UKAWGIIJ)
4.80% Chg Yr for Mar 2026
Level Chart
Basic Info
|
UK Average Weekly Earnings: Public Sector (except Financial Services) Growth (3 Months Average) is at 4.80%, compared to 5.10% last month and 5.90% last year. This is higher than the long term average of 3.33%. |
| Report | UK Labor Market Statistics |
| Categories | Employment , Hours and Wages |
| Region | United Kingdom |
| Source | Office for National Statistics |
Stats
| Last Value | 4.80% |
| Latest Period | Mar 2026 |
| Last Updated | May 19 2026, 04:31 EDT |
| Next Release | Jun 18 2026, 04:30 EDT |
| Long Term Average | 3.33% |
| Average Growth Rate | 17.01% |
| Value from Last Month | 5.10% |
| Change from Last Month | -5.88% |
| Value from 1 Year Ago | 5.90% |
| Change from 1 Year Ago | -18.64% |
| Frequency | Monthly |
| Unit | Percent Change from Year Ago |
| Adjustment | Seasonally Adjusted |
| Download Source File |
Historical Data
| Date | Value |
|---|---|
| March 31, 2026 | 4.80% |
| February 28, 2026 | 5.10% |
| January 31, 2026 | 5.90% |
| December 31, 2025 | 7.00% |
| November 30, 2025 | 8.00% |
| October 31, 2025 | 8.20% |
| September 30, 2025 | 7.40% |
| August 31, 2025 | 6.70% |
| July 31, 2025 | 6.00% |
| June 30, 2025 | 6.10% |
| May 31, 2025 | 5.90% |
| April 30, 2025 | 6.00% |
| March 31, 2025 | 5.90% |
| February 28, 2025 | 6.10% |
| January 31, 2025 | 5.60% |
| December 31, 2024 | 5.10% |
| November 30, 2024 | 4.20% |
| October 31, 2024 | 4.10% |
| September 30, 2024 | 3.30% |
| August 31, 2024 | 0.00% |
| July 31, 2024 | 0.70% |
| June 30, 2024 | 1.80% |
| May 31, 2024 | 6.30% |
| April 30, 2024 | 6.20% |
| March 31, 2024 | 6.30% |
| Date | Value |
|---|---|
| February 29, 2024 | 6.10% |
| January 31, 2024 | 6.00% |
| December 31, 2023 | 6.00% |
| November 30, 2023 | 6.70% |
| October 31, 2023 | 7.20% |
| September 30, 2023 | 8.70% |
| August 31, 2023 | 12.60% |
| July 31, 2023 | 12.10% |
| June 30, 2023 | 10.70% |
| May 31, 2023 | 5.90% |
| April 30, 2023 | 5.70% |
| March 31, 2023 | 5.50% |
| February 28, 2023 | 5.20% |
| January 31, 2023 | 4.90% |
| December 31, 2022 | 4.30% |
| November 30, 2022 | 3.40% |
| October 31, 2022 | 2.80% |
| September 30, 2022 | 2.20% |
| August 31, 2022 | 2.20% |
| July 31, 2022 | 1.80% |
| June 30, 2022 | 1.60% |
| May 31, 2022 | 1.50% |
| April 30, 2022 | 1.50% |
| March 31, 2022 | 1.70% |
| February 28, 2022 | 2.00% |
News
Headline
Time (ET)
05/08 07:44
Basic Info
|
UK Average Weekly Earnings: Public Sector (except Financial Services) Growth (3 Months Average) is at 4.80%, compared to 5.10% last month and 5.90% last year. This is higher than the long term average of 3.33%. |
| Report | UK Labor Market Statistics |
| Categories | Employment , Hours and Wages |
| Region | United Kingdom |
| Source | Office for National Statistics |
Stats
| Last Value | 4.80% |
| Latest Period | Mar 2026 |
| Last Updated | May 19 2026, 04:31 EDT |
| Next Release | Jun 18 2026, 04:30 EDT |
| Long Term Average | 3.33% |
| Average Growth Rate | 17.01% |
| Value from Last Month | 5.10% |
| Change from Last Month | -5.88% |
| Value from 1 Year Ago | 5.90% |
| Change from 1 Year Ago | -18.64% |
| Frequency | Monthly |
| Unit | Percent Change from Year Ago |
| Adjustment | Seasonally Adjusted |
| Download Source File |
Related Indicators
| UK Economy |
| UK Average House Price YoY | 0.04% |
| UK Average Weekly Earnings: Growth (3 Months Average) | 4.10% Chg Yr |
| UK Balance of Trade | -13.69B GBP |
| UK Business Investment QoQ | 0.71% |
| UK Business Investment YoY | -1.75% |
| UK Consumer Price Index MoM | 0.70% |
| UK Consumer Price Index YoY | 2.80% |
| UK Core Consumer Price Index YoY | 2.45% |
| UK ILO Unemployment Rate: Aged 16-64 | 5.10% |
| UK Industrial Production Index MoM | -0.20% |
| UK Industrial Production Index YoY | 0.00% |
| UK Producer Price Index: Core Output MoM | 0.29% |
| UK Producer Price Index: Core Output YoY | 1.48% |
| UK Producer Price Index: Input MoM | 0.82% |
| UK Producer Price Index: Input YoY | -0.14% |
| UK Producer Price Index: Output MoM | 0.51% |
| UK Producer Price Index: Output YoY | 0.29% |
| UK Public Sector Net Borrowing | 24.34B GBP |
| UK Real GDP QoQ | 0.60% |
| UK Real GDP YoY | 1.10% |
| UK Retail Sales excluding Fuel MoM | -0.40% |
| UK Retail Sales excluding Fuel YoY | 1.10% |
| UK Retail Sales MoM | -1.30% |
| UK Retail Sales YoY | 0.00% |