

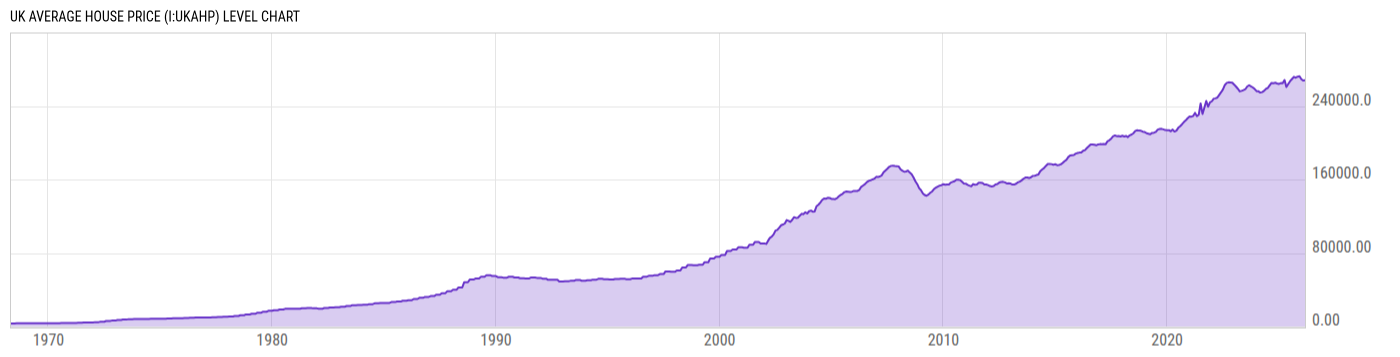
UK Average House Price (I:UKAHP)
268132.0 GBP for Mar 2026
Level Chart
Basic Info
|
UK Average House Price is at a current level of 268132.0, down from 269204.0 last month and up from 268019.0 one year ago. This is a change of -0.40% from last month and 0.04% from one year ago. |
| Report | UK House Price Index |
| Category | House Prices |
| Region | United Kingdom |
| Source | Office for National Statistics |
Stats
| Last Value | 268132.0 |
| Latest Period | Mar 2026 |
| Last Updated | May 20 2026, 04:31 EDT |
| Next Release | Jun 17 2026, 04:30 EDT |
| Average Growth Rate | 7.79% |
| Value from Last Month | 269204.0 |
| Change from Last Month | -0.40% |
| Value from 1 Year Ago | 268019.0 |
| Change from 1 Year Ago | 0.04% |
| Frequency | Monthly |
| Unit | GBP |
| Adjustment | Not Seasonally Adjusted |
| Download Source File |
Historical Data
| Date | Value |
|---|---|
| March 31, 2026 | 268132.0 |
| February 28, 2026 | 269204.0 |
| January 31, 2026 | 267826.0 |
| December 31, 2025 | 268386.0 |
| November 30, 2025 | 271527.0 |
| October 31, 2025 | 271490.0 |
| September 30, 2025 | 270647.0 |
| August 31, 2025 | 271497.0 |
| July 31, 2025 | 268580.0 |
| June 30, 2025 | 266506.0 |
| May 31, 2025 | 263921.0 |
| April 30, 2025 | 260288.0 |
| March 31, 2025 | 268019.0 |
| February 28, 2025 | 264771.0 |
| January 31, 2025 | 264936.0 |
| December 31, 2024 | 263991.0 |
| November 30, 2024 | 264515.0 |
| October 31, 2024 | 265252.0 |
| September 30, 2024 | 264750.0 |
| August 31, 2024 | 265085.0 |
| July 31, 2024 | 262479.0 |
| June 30, 2024 | 259585.0 |
| May 31, 2024 | 258565.0 |
| April 30, 2024 | 256478.0 |
| March 31, 2024 | 255082.0 |
| Date | Value |
|---|---|
| February 29, 2024 | 254633.0 |
| January 31, 2024 | 255972.0 |
| December 31, 2023 | 256177.0 |
| November 30, 2023 | 258368.0 |
| October 31, 2023 | 260129.0 |
| September 30, 2023 | 261318.0 |
| August 31, 2023 | 262602.0 |
| July 31, 2023 | 261182.0 |
| June 30, 2023 | 258275.0 |
| May 31, 2023 | 257330.0 |
| April 30, 2023 | 256479.0 |
| March 31, 2023 | 255885.0 |
| February 28, 2023 | 258788.0 |
| January 31, 2023 | 260941.0 |
| December 31, 2022 | 263190.0 |
| November 30, 2022 | 265299.0 |
| October 31, 2022 | 265693.0 |
| September 30, 2022 | 265727.0 |
| August 31, 2022 | 265124.0 |
| July 31, 2022 | 262904.0 |
| June 30, 2022 | 258118.0 |
| May 31, 2022 | 255040.0 |
| April 30, 2022 | 252167.0 |
| March 31, 2022 | 249232.0 |
| February 28, 2022 | 248309.0 |
News
Headline
Time (ET)
05/15 07:05
05/14 07:24
Basic Info
|
UK Average House Price is at a current level of 268132.0, down from 269204.0 last month and up from 268019.0 one year ago. This is a change of -0.40% from last month and 0.04% from one year ago. |
| Report | UK House Price Index |
| Category | House Prices |
| Region | United Kingdom |
| Source | Office for National Statistics |
Stats
| Last Value | 268132.0 |
| Latest Period | Mar 2026 |
| Last Updated | May 20 2026, 04:31 EDT |
| Next Release | Jun 17 2026, 04:30 EDT |
| Average Growth Rate | 7.79% |
| Value from Last Month | 269204.0 |
| Change from Last Month | -0.40% |
| Value from 1 Year Ago | 268019.0 |
| Change from 1 Year Ago | 0.04% |
| Frequency | Monthly |
| Unit | GBP |
| Adjustment | Not Seasonally Adjusted |
| Download Source File |