

Tokyo Consumer Price Index: All Items, Less Fresh Food (I:TCPIAIUM)
111.70 for Apr 2026
Level Chart
Basic Info
|
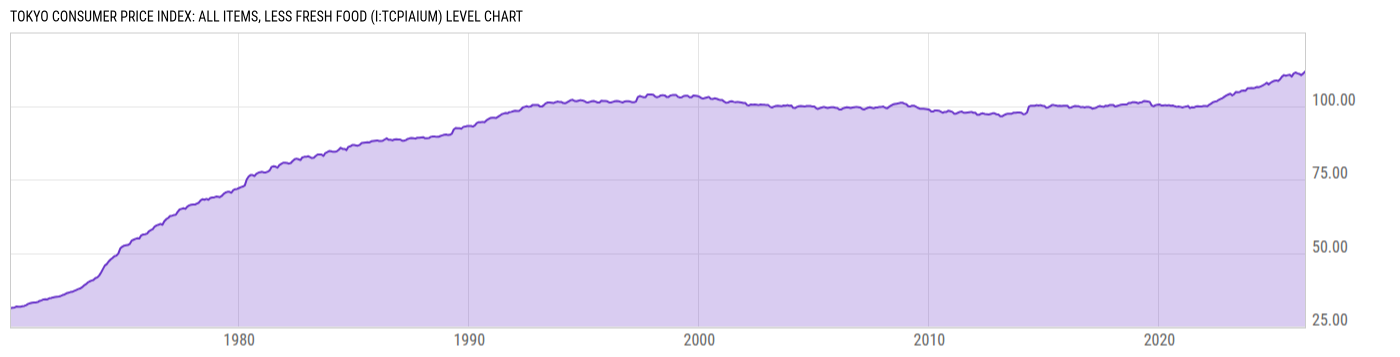
Tokyo Consumer Price Index: All Items, Less Fresh Food is at a current level of 111.70, up from 111.00 last month and up from 110.00 one year ago. This is a change of 0.63% from last month and 1.55% from one year ago. |
| Report | Tokyo Consumer Price Index |
| Category | Consumer Prices |
| Region | N/A |
| Source | Japan Statistics Bureau |
Stats
| Last Value | 111.70 |
| Latest Period | Apr 2026 |
| Last Updated | Apr 30 2026, 21:04 EDT |
| Next Release | May 28 2026, 21:00 EDT |
| Average Growth Rate | 2.28% |
| Value from Last Month | 111.00 |
| Change from Last Month | 0.63% |
| Value from 1 Year Ago | 110.00 |
| Change from 1 Year Ago | 1.55% |
| Frequency | Monthly |
| Unit | Index 2020=100 |
| Adjustment | Not Seasonally Adjusted |
| Download Source File |
Historical Data
| Date | Value |
|---|---|
| April 30, 2026 | 111.70 |
| March 31, 2026 | 111.00 |
| February 28, 2026 | 110.50 |
| January 31, 2026 | 110.90 |
| December 31, 2025 | 111.10 |
| November 30, 2025 | 111.40 |
| October 31, 2025 | 111.00 |
| September 30, 2025 | 110.00 |
| August 31, 2025 | 110.60 |
| July 31, 2025 | 110.50 |
| June 30, 2025 | 110.30 |
| May 31, 2025 | 110.50 |
| April 30, 2025 | 110.00 |
| March 31, 2025 | 109.10 |
| February 28, 2025 | 108.50 |
| January 31, 2025 | 108.70 |
| December 31, 2024 | 108.60 |
| November 30, 2024 | 108.30 |
| October 31, 2024 | 107.90 |
| September 30, 2024 | 107.30 |
| August 31, 2024 | 107.90 |
| July 31, 2024 | 107.40 |
| June 30, 2024 | 107.00 |
| May 31, 2024 | 106.70 |
| April 30, 2024 | 106.40 |
| Date | Value |
|---|---|
| March 31, 2024 | 106.50 |
| February 29, 2024 | 106.20 |
| January 31, 2024 | 106.00 |
| December 31, 2023 | 106.10 |
| November 30, 2023 | 106.00 |
| October 31, 2023 | 106.00 |
| September 30, 2023 | 105.20 |
| August 31, 2023 | 105.30 |
| July 31, 2023 | 105.20 |
| June 30, 2023 | 104.80 |
| May 31, 2023 | 104.70 |
| April 30, 2023 | 104.80 |
| March 31, 2023 | 104.00 |
| February 28, 2023 | 103.60 |
| January 31, 2023 | 104.20 |
| December 31, 2022 | 103.90 |
| November 30, 2022 | 103.60 |
| October 31, 2022 | 103.20 |
| September 30, 2022 | 102.70 |
| August 31, 2022 | 102.40 |
| July 31, 2022 | 102.10 |
| June 30, 2022 | 101.60 |
| May 31, 2022 | 101.50 |
| April 30, 2022 | 101.30 |
| March 31, 2022 | 100.80 |
News
Headline
Time (ET)
05/14 06:14
Basic Info
|
Tokyo Consumer Price Index: All Items, Less Fresh Food is at a current level of 111.70, up from 111.00 last month and up from 110.00 one year ago. This is a change of 0.63% from last month and 1.55% from one year ago. |
| Report | Tokyo Consumer Price Index |
| Category | Consumer Prices |
| Region | N/A |
| Source | Japan Statistics Bureau |
Stats
| Last Value | 111.70 |
| Latest Period | Apr 2026 |
| Last Updated | Apr 30 2026, 21:04 EDT |
| Next Release | May 28 2026, 21:00 EDT |
| Average Growth Rate | 2.28% |
| Value from Last Month | 111.00 |
| Change from Last Month | 0.63% |
| Value from 1 Year Ago | 110.00 |
| Change from 1 Year Ago | 1.55% |
| Frequency | Monthly |
| Unit | Index 2020=100 |
| Adjustment | Not Seasonally Adjusted |
| Download Source File |