

Tobin's Q (I:TQ)
Level Chart
Basic Info
|
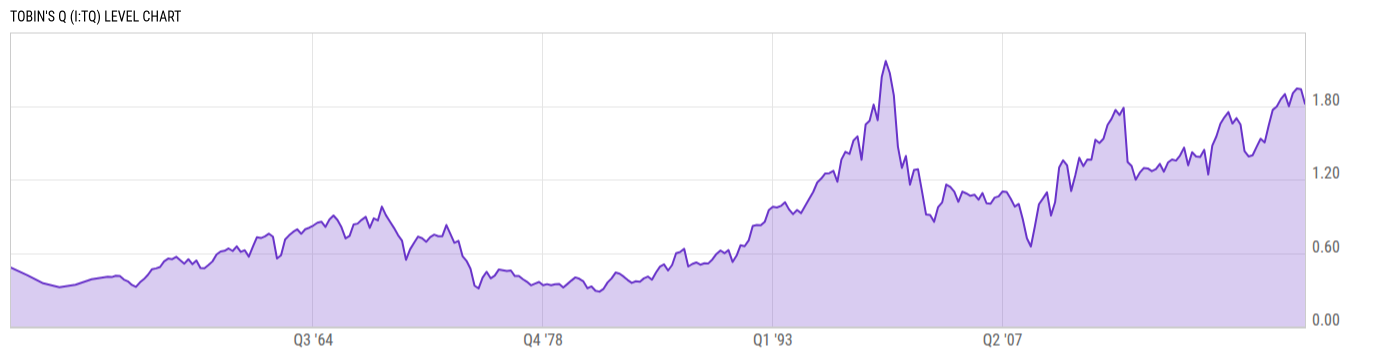
Tobin's Q is at a current level of 1.819, down from 1.936 last quarter and up from 1.798 one year ago. This is a change of -6.05% from last quarter and 1.15% from one year ago. |
|
Tobin's Q is the market value of all public companies in the US divided by their replacement cost. Many macroeconomists consider the market overvalued when Tobin's Q is above its long term mean and undervalued when it is below the long-term mean. |
| Region | United States |
| Source | Federal Reserve |
Stats
| Last Value | 1.819 |
| Latest Period | Mar 2026 |
| Last Updated | Jun 12 2026, 08:56 EDT |
| Average Growth Rate | 3.32% |
| Value from Last Quarter | 1.936 |
| Change from Last Quarter | -6.05% |
| Value from 1 Year Ago | 1.798 |
| Change from 1 Year Ago | 1.15% |
| Frequency | Quarterly |
| Adjustment | Not Seasonally Adjusted |
| Notes | The ratio is calculated using the Z.1 Flow of Funds Report. It is B.102 Line 35 (Market Value of Equities Outstanding - Net Worth (Market Value) - Balance Sheet of Nonfarm Nonfinancial Corporate Business) divided by Line 32 (Total Net Worth (Market Value) - Balance Sheet of Nonfarm Nonfinancial Corporate Business). |
| Formula | US Market Value of Equities Outstanding - Net Worth (Market Value) - Balance Sheet of Nonfarm Nonfinancial Corporate Business / US Total Net Worth (Market Value) - Balance Sheet of Nonfarm Nonfinancial Corporate Business |
Historical Data
| Date | Value |
|---|---|
| March 31, 2026 | 1.819 |
| December 31, 2025 | 1.936 |
| September 30, 2025 | 1.943 |
| June 30, 2025 | 1.905 |
| March 31, 2025 | 1.798 |
| December 31, 2024 | 1.897 |
| September 30, 2024 | 1.856 |
| June 30, 2024 | 1.796 |
| March 31, 2024 | 1.768 |
| December 31, 2023 | 1.643 |
| September 30, 2023 | 1.503 |
| June 30, 2023 | 1.533 |
| March 31, 2023 | 1.466 |
| December 31, 2022 | 1.398 |
| September 30, 2022 | 1.388 |
| June 30, 2022 | 1.431 |
| March 31, 2022 | 1.649 |
| December 31, 2021 | 1.701 |
| September 30, 2021 | 1.656 |
| June 30, 2021 | 1.750 |
| March 31, 2021 | 1.708 |
| December 31, 2020 | 1.655 |
| September 30, 2020 | 1.551 |
| June 30, 2020 | 1.476 |
| March 31, 2020 | 1.241 |
| Date | Value |
|---|---|
| December 31, 2019 | 1.442 |
| September 30, 2019 | 1.384 |
| June 30, 2019 | 1.388 |
| March 31, 2019 | 1.422 |
| December 31, 2018 | 1.316 |
| September 30, 2018 | 1.460 |
| June 30, 2018 | 1.395 |
| March 31, 2018 | 1.354 |
| December 31, 2017 | 1.364 |
| September 30, 2017 | 1.338 |
| June 30, 2017 | 1.264 |
| March 31, 2017 | 1.327 |
| December 31, 2016 | 1.284 |
| September 30, 2016 | 1.268 |
| June 30, 2016 | 1.290 |
| March 31, 2016 | 1.293 |
| December 31, 2015 | 1.255 |
| September 30, 2015 | 1.198 |
| June 30, 2015 | 1.310 |
| March 31, 2015 | 1.342 |
| December 31, 2014 | 1.785 |
| September 30, 2014 | 1.726 |
| June 30, 2014 | 1.768 |
| March 31, 2014 | 1.695 |
| December 31, 2013 | 1.645 |
News
Basic Info
|
Tobin's Q is at a current level of 1.819, down from 1.936 last quarter and up from 1.798 one year ago. This is a change of -6.05% from last quarter and 1.15% from one year ago. |
|
Tobin's Q is the market value of all public companies in the US divided by their replacement cost. Many macroeconomists consider the market overvalued when Tobin's Q is above its long term mean and undervalued when it is below the long-term mean. |
| Region | United States |
| Source | Federal Reserve |
Stats
| Last Value | 1.819 |
| Latest Period | Mar 2026 |
| Last Updated | Jun 12 2026, 08:56 EDT |
| Average Growth Rate | 3.32% |
| Value from Last Quarter | 1.936 |
| Change from Last Quarter | -6.05% |
| Value from 1 Year Ago | 1.798 |
| Change from 1 Year Ago | 1.15% |
| Frequency | Quarterly |
| Adjustment | Not Seasonally Adjusted |
| Notes | The ratio is calculated using the Z.1 Flow of Funds Report. It is B.102 Line 35 (Market Value of Equities Outstanding - Net Worth (Market Value) - Balance Sheet of Nonfarm Nonfinancial Corporate Business) divided by Line 32 (Total Net Worth (Market Value) - Balance Sheet of Nonfarm Nonfinancial Corporate Business). |
| Formula | US Market Value of Equities Outstanding - Net Worth (Market Value) - Balance Sheet of Nonfarm Nonfinancial Corporate Business / US Total Net Worth (Market Value) - Balance Sheet of Nonfarm Nonfinancial Corporate Business |