

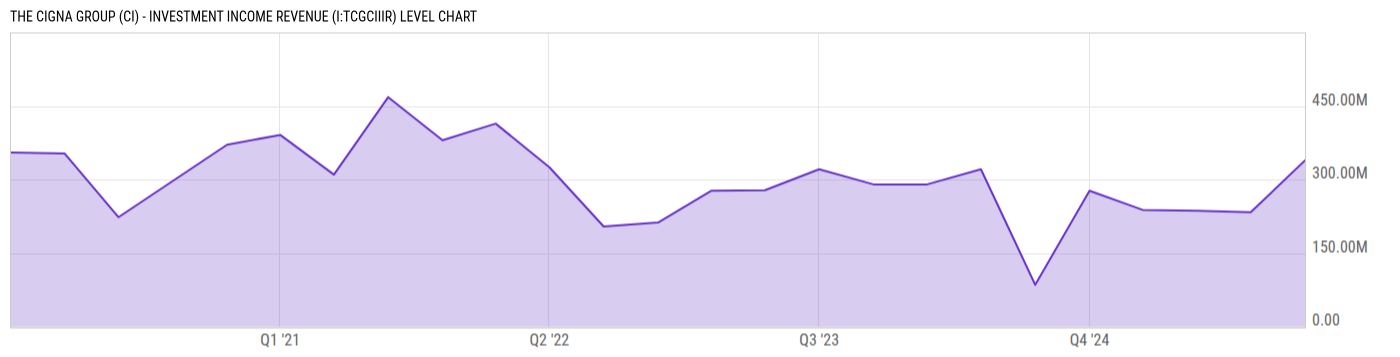
The Cigna Group (CI) - Investment Income Revenue (I:TCGCIIIR)
339.00M USD for Q4 2025
Level Chart
Basic Info
|
The Cigna Group (CI) - Investment Income Revenue is at a current level of 339.00M, up from 233.00M last quarter and up from 277.00M one year ago. This is a change of 45.49% from last quarter and 22.38% from one year ago. |
| Report | Fiscal.ai |
| Category | Segments & KPIs |
| Region | United States |
| Source | Fiscal.ai |
|
Data provided via Fiscal.ai |
Stats
| Last Value | 339.00M |
| Latest Period | Dec 2025 |
| Last Updated | Mar 23 2026, 14:15 EDT |
| Next Release | Jul 15 2026, 08:30 EDT (E) |
| Average Growth Rate | 36.81% |
| Value from Last Quarter | 233.00M |
| Change from Last Quarter | 45.49% |
| Value from 1 Year Ago | 277.00M |
| Change from 1 Year Ago | 22.38% |
| Frequency | Quarterly |
| Unit | USD |
| Adjustment | N/A |
| Download Source File |
Historical Data
| Date | Value |
|---|---|
| December 31, 2025 | 339.00M |
| September 30, 2025 | 233.00M |
| June 30, 2025 | 236.00M |
| March 31, 2025 | 238.00M |
| December 31, 2024 | 277.00M |
| September 30, 2024 | 85.00M |
| June 30, 2024 | 321.00M |
| March 31, 2024 | 290.00M |
| December 31, 2023 | 290.00M |
| September 30, 2023 | 321.00M |
| June 30, 2023 | 278.00M |
| March 31, 2023 | 277.00M |
| December 31, 2022 | 212.00M |
| Date | Value |
|---|---|
| September 30, 2022 | 204.00M |
| June 30, 2022 | 325.00M |
| March 31, 2022 | 414.00M |
| December 31, 2021 | 380.00M |
| September 30, 2021 | 468.00M |
| June 30, 2021 | 310.00M |
| March 31, 2021 | 391.00M |
| December 31, 2020 | 371.00M |
| September 30, 2020 | 297.00M |
| June 30, 2020 | 223.00M |
| March 31, 2020 | 353.00M |
| December 31, 2019 | 355.00M |
News
Headline
Time (ET)
05/22 14:40
05/11 16:10
05/08 08:40
Basic Info
|
The Cigna Group (CI) - Investment Income Revenue is at a current level of 339.00M, up from 233.00M last quarter and up from 277.00M one year ago. This is a change of 45.49% from last quarter and 22.38% from one year ago. |
| Report | Fiscal.ai |
| Category | Segments & KPIs |
| Region | United States |
| Source | Fiscal.ai |
|
Data provided via Fiscal.ai |
Stats
| Last Value | 339.00M |
| Latest Period | Dec 2025 |
| Last Updated | Mar 23 2026, 14:15 EDT |
| Next Release | Jul 15 2026, 08:30 EDT (E) |
| Average Growth Rate | 36.81% |
| Value from Last Quarter | 233.00M |
| Change from Last Quarter | 45.49% |
| Value from 1 Year Ago | 277.00M |
| Change from 1 Year Ago | 22.38% |
| Frequency | Quarterly |
| Unit | USD |
| Adjustment | N/A |
| Download Source File |