

The Amazon.com Inc (AMZN) - Online Stores Revenue (I:TAIAWTT3)
Level Chart
Basic Info
|
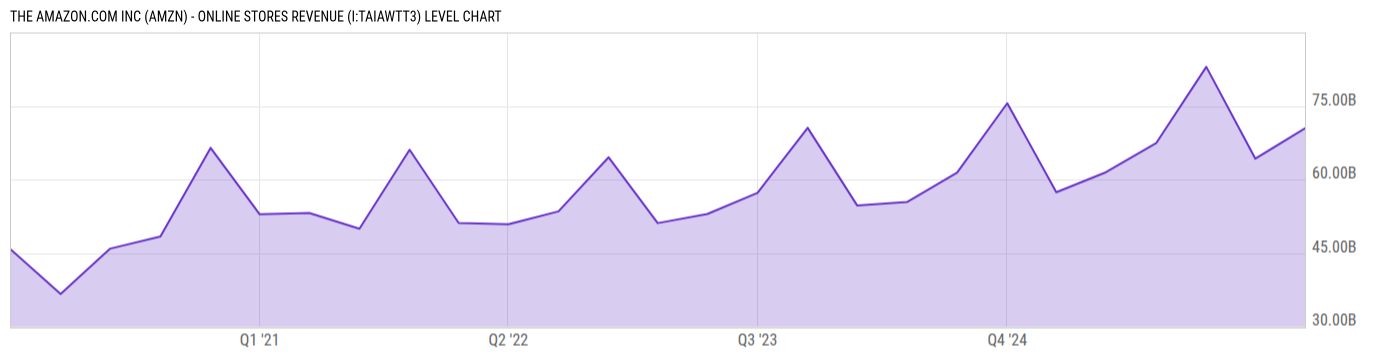
The Amazon.com Inc (AMZN) - Online Stores Revenue is at a current level of 70.43B, up from 64.25B last quarter and up from 61.48B one year ago. This is a change of 9.61% from last quarter and 14.55% from one year ago. |
|
Online Stores Revenue data set provides an analysis of the revenue generated through Amazon's online retail operations. This data set focuses on tracking and evaluating the financial performance of Amazon's e-commerce platform, including sales of physical products across various categories. By examining the Online Stores revenue data, investors, analysts, and industry professionals can gain insights into Amazon's dominance in the online retail market, assess the growth trajectory of its core business, and evaluate the impact of factors such as consumer spending trends, pricing strategies, and competitive dynamics on its revenue performance. |
| Report | Fiscal.ai |
| Category | Segments & KPIs |
| Region | United States |
| Source | Fiscal.ai |
|
Data provided via Fiscal.ai |
Stats
| Last Value | 70.43B |
| Latest Period | Jun 2026 |
| Last Updated | Jul 31 2026, 10:02 EDT |
| Next Release | Oct 29 2026, 08:30 EDT (E) |
| Average Growth Rate | 13.39% |
| Value from Last Quarter | 64.25B |
| Change from Last Quarter | 9.61% |
| Value from 1 Year Ago | 61.48B |
| Change from 1 Year Ago | 14.55% |
| Frequency | Quarterly |
| Unit | USD |
| Adjustment | N/A |
| Download Source File |
Historical Data
| Date | Value |
|---|---|
| June 30, 2026 | 70.43B |
| March 31, 2026 | 64.25B |
| December 31, 2025 | 82.99B |
| September 30, 2025 | 67.41B |
| June 30, 2025 | 61.48B |
| March 31, 2025 | 57.41B |
| December 31, 2024 | 75.56B |
| September 30, 2024 | 61.41B |
| June 30, 2024 | 55.39B |
| March 31, 2024 | 54.67B |
| December 31, 2023 | 70.54B |
| September 30, 2023 | 57.27B |
| June 30, 2023 | 52.97B |
| March 31, 2023 | 51.10B |
| Date | Value |
|---|---|
| December 31, 2022 | 64.53B |
| September 30, 2022 | 53.49B |
| June 30, 2022 | 50.86B |
| March 31, 2022 | 51.13B |
| December 31, 2021 | 66.08B |
| September 30, 2021 | 49.94B |
| June 30, 2021 | 53.16B |
| March 31, 2021 | 52.90B |
| December 31, 2020 | 66.45B |
| September 30, 2020 | 48.35B |
| June 30, 2020 | 45.90B |
| March 31, 2020 | 36.65B |
| December 31, 2019 | 45.66B |
News
Basic Info
|
The Amazon.com Inc (AMZN) - Online Stores Revenue is at a current level of 70.43B, up from 64.25B last quarter and up from 61.48B one year ago. This is a change of 9.61% from last quarter and 14.55% from one year ago. |
|
Online Stores Revenue data set provides an analysis of the revenue generated through Amazon's online retail operations. This data set focuses on tracking and evaluating the financial performance of Amazon's e-commerce platform, including sales of physical products across various categories. By examining the Online Stores revenue data, investors, analysts, and industry professionals can gain insights into Amazon's dominance in the online retail market, assess the growth trajectory of its core business, and evaluate the impact of factors such as consumer spending trends, pricing strategies, and competitive dynamics on its revenue performance. |
| Report | Fiscal.ai |
| Category | Segments & KPIs |
| Region | United States |
| Source | Fiscal.ai |
|
Data provided via Fiscal.ai |
Stats
| Last Value | 70.43B |
| Latest Period | Jun 2026 |
| Last Updated | Jul 31 2026, 10:02 EDT |
| Next Release | Oct 29 2026, 08:30 EDT (E) |
| Average Growth Rate | 13.39% |
| Value from Last Quarter | 64.25B |
| Change from Last Quarter | 9.61% |
| Value from 1 Year Ago | 61.48B |
| Change from 1 Year Ago | 14.55% |
| Frequency | Quarterly |
| Unit | USD |
| Adjustment | N/A |
| Download Source File |