

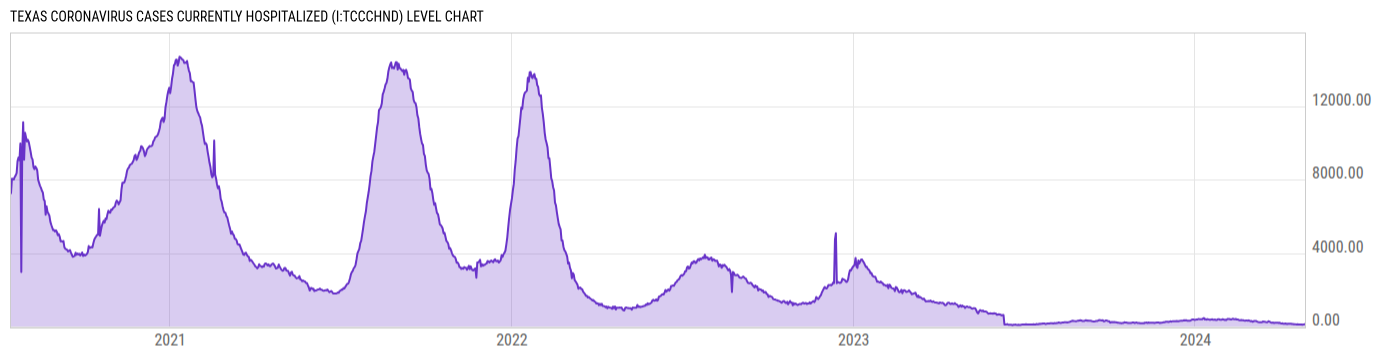
Texas Coronavirus Cases Currently Hospitalized (I:TCCCHND)
121.00 for Apr 27 2024
Level Chart
Basic Info
|
Texas Coronavirus Cases Currently Hospitalized is at a current level of 121.00, up from 116.00 yesterday and down from 1090.00 one year ago. This is a change of 4.31% from yesterday and -88.90% from one year ago. |
| Region | Texas |
| Source | US Department of Health & Human Services |
Stats
| Last Value | 121.00 |
| Latest Period | Apr 27 2024 |
| Last Updated | May 6 2024, 18:05 EDT |
| Next Release | Jun 1 2026, 18:00 EDT (E) |
| Average Growth Rate | 26.46% |
| Value from Yesterday | 116.00 |
| Change from Yesterday | 4.31% |
| Value from 1 Year Ago | 1090.00 |
| Change from 1 Year Ago | -88.90% |
| Frequency | Daily |
| Adjustment | N/A |
| Download Source File | |
| Notes | Reported patients currently hospitalized in an adult inpatient bed who have laboratory-confirmed or suspected COVID-19. This include those in observation beds. |
Historical Data
| Date | Value |
|---|---|
| April 27, 2024 | 121.00 |
| April 26, 2024 | 116.00 |
| April 25, 2024 | 107.00 |
| April 24, 2024 | 99.00 |
| April 23, 2024 | 115.00 |
| April 22, 2024 | 112.00 |
| April 21, 2024 | 112.00 |
| April 20, 2024 | 109.00 |
| April 19, 2024 | 124.00 |
| April 18, 2024 | 114.00 |
| April 17, 2024 | 116.00 |
| April 16, 2024 | 126.00 |
| April 15, 2024 | 119.00 |
| April 14, 2024 | 132.00 |
| April 13, 2024 | 136.00 |
| April 12, 2024 | 149.00 |
| April 11, 2024 | 146.00 |
| April 10, 2024 | 149.00 |
| April 09, 2024 | 150.00 |
| April 08, 2024 | 135.00 |
| April 07, 2024 | 150.00 |
| April 06, 2024 | 161.00 |
| April 05, 2024 | 150.00 |
| April 04, 2024 | 146.00 |
| April 03, 2024 | 173.00 |
| Date | Value |
|---|---|
| April 02, 2024 | 158.00 |
| April 01, 2024 | 178.00 |
| March 31, 2024 | 202.00 |
| March 30, 2024 | 187.00 |
| March 29, 2024 | 205.00 |
| March 28, 2024 | 208.00 |
| March 27, 2024 | 208.00 |
| March 26, 2024 | 207.00 |
| March 25, 2024 | 188.00 |
| March 24, 2024 | 215.00 |
| March 23, 2024 | 205.00 |
| March 22, 2024 | 203.00 |
| March 21, 2024 | 237.00 |
| March 20, 2024 | 262.00 |
| March 19, 2024 | 284.00 |
| March 18, 2024 | 238.00 |
| March 17, 2024 | 235.00 |
| March 16, 2024 | 243.00 |
| March 15, 2024 | 253.00 |
| March 14, 2024 | 256.00 |
| March 13, 2024 | 268.00 |
| March 12, 2024 | 228.00 |
| March 11, 2024 | 227.00 |
| March 10, 2024 | 227.00 |
| March 09, 2024 | 237.00 |
News
Headline
Time (ET)
05/18 13:45
Basic Info
|
Texas Coronavirus Cases Currently Hospitalized is at a current level of 121.00, up from 116.00 yesterday and down from 1090.00 one year ago. This is a change of 4.31% from yesterday and -88.90% from one year ago. |
| Region | Texas |
| Source | US Department of Health & Human Services |
Stats
| Last Value | 121.00 |
| Latest Period | Apr 27 2024 |
| Last Updated | May 6 2024, 18:05 EDT |
| Next Release | Jun 1 2026, 18:00 EDT (E) |
| Average Growth Rate | 26.46% |
| Value from Yesterday | 116.00 |
| Change from Yesterday | 4.31% |
| Value from 1 Year Ago | 1090.00 |
| Change from 1 Year Ago | -88.90% |
| Frequency | Daily |
| Adjustment | N/A |
| Download Source File | |
| Notes | Reported patients currently hospitalized in an adult inpatient bed who have laboratory-confirmed or suspected COVID-19. This include those in observation beds. |
Related Indicators
| Texas Coronavirus Stats |