

Summary of Economic Projections: Change in Real GDP (I:SEPCRGDP)
1.90% for 2028
Level Chart
Basic Info
|
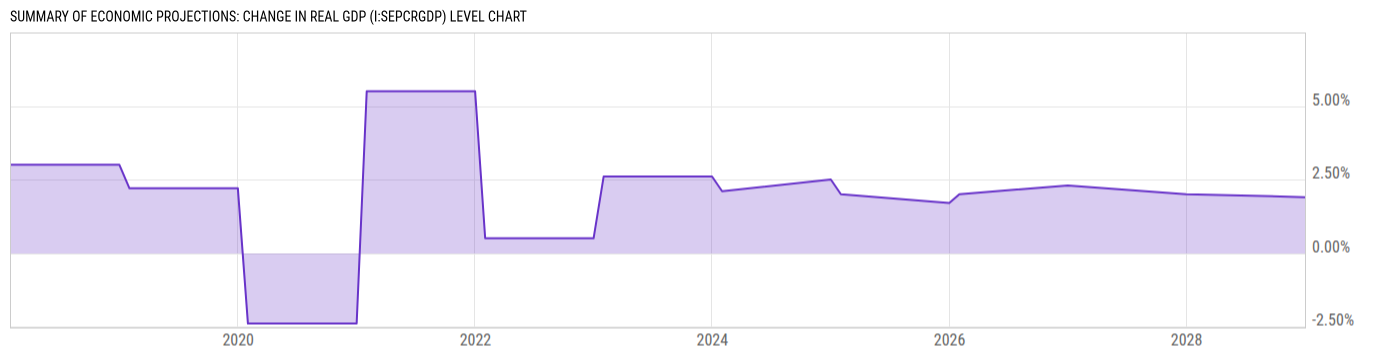
Summary of Economic Projections: Change in Real GDP is at 1.90%, compared to 2.00% last year. This is lower than the long term average of 1.96%. |
| Report | Federal Open Market Committee Meeting |
| Category | Interest Rates |
| Region | United States |
| Source | Federal Reserve |
Stats
| Last Value | 1.90% |
| Latest Period | 2028 |
| Last Updated | Dec 10 2025, 14:05 EST |
| Next Release | Jun 17 2026, 14:00 EDT |
| Long Term Average | 1.96% |
| Average Growth Rate | -13.50% |
| Value from 1 Year Ago | 2.00% |
| Change from 1 Year Ago | -5.00% |
| Frequency | Yearly |
| Unit | Percent |
| Adjustment | N/A |
| Download Source File | |
| Notes | Displaying the latest median projection. For each period, the median is the middle projection when the projections are arranged from lowest to highest. When the number of projections is even, the median is the average of the two middle projections. Median projections of change in real gross domestic product (GDP) are percent changes from the fourth quarter of the previous year to the fourth quarter of the year indicated. |
Historical Data
| Date | Value |
|---|---|
| December 31, 2028 | 1.90% |
| December 31, 2027 | 2.00% |
| December 31, 2026 | 2.30% |
| January 31, 2026 | 2.00% |
| December 31, 2025 | 1.70% |
| January 31, 2025 | 2.00% |
| December 31, 2024 | 2.50% |
| January 31, 2024 | 2.10% |
| December 31, 2023 | 2.60% |
| January 31, 2023 | 2.60% |
| Date | Value |
|---|---|
| December 31, 2022 | 0.50% |
| January 31, 2022 | 0.50% |
| December 31, 2021 | 5.50% |
| January 31, 2021 | 5.50% |
| December 31, 2020 | -2.40% |
| January 31, 2020 | -2.40% |
| December 31, 2019 | 2.20% |
| January 31, 2019 | 2.20% |
| December 31, 2018 | 3.00% |
| January 31, 2018 | 3.00% |
News
Headline
Time (ET)
06/08 08:25
06/08 07:05
06/01 07:55
05/12 08:25
05/11 07:48
Basic Info
|
Summary of Economic Projections: Change in Real GDP is at 1.90%, compared to 2.00% last year. This is lower than the long term average of 1.96%. |
| Report | Federal Open Market Committee Meeting |
| Category | Interest Rates |
| Region | United States |
| Source | Federal Reserve |
Stats
| Last Value | 1.90% |
| Latest Period | 2028 |
| Last Updated | Dec 10 2025, 14:05 EST |
| Next Release | Jun 17 2026, 14:00 EDT |
| Long Term Average | 1.96% |
| Average Growth Rate | -13.50% |
| Value from 1 Year Ago | 2.00% |
| Change from 1 Year Ago | -5.00% |
| Frequency | Yearly |
| Unit | Percent |
| Adjustment | N/A |
| Download Source File | |
| Notes | Displaying the latest median projection. For each period, the median is the middle projection when the projections are arranged from lowest to highest. When the number of projections is even, the median is the average of the two middle projections. Median projections of change in real gross domestic product (GDP) are percent changes from the fourth quarter of the previous year to the fourth quarter of the year indicated. |