

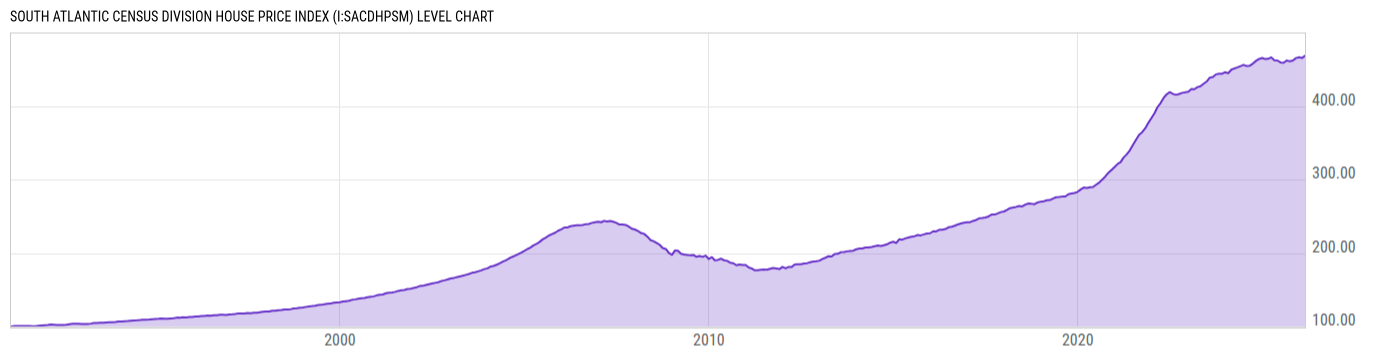
South Atlantic Census Division House Price Index (I:SACDHPSM)
467.65 for Mar 2026
Level Chart
Basic Info
|
South Atlantic Census Division House Price Index is at a current level of 467.65, down from 467.96 last month and up from 465.48 one year ago. This is a change of -0.07% from last month and 0.47% from one year ago. |
| Report | FHFA House Price Index |
| Category | House Prices |
| Region | United States |
| Source | Federal Housing Finance Agency |
Stats
| Last Value | 467.65 |
| Latest Period | Mar 2026 |
| Last Updated | May 26 2026, 09:02 EDT |
| Next Release | Jun 30 2026, 09:00 EDT |
| Average Growth Rate | 4.42% |
| Value from Last Month | 467.96 |
| Change from Last Month | -0.07% |
| Value from 1 Year Ago | 465.48 |
| Change from 1 Year Ago | 0.47% |
| Frequency | Monthly |
| Unit | Index January 1991=100 |
| Adjustment | Seasonally Adjusted |
| Download Source File |
Historical Data
| Date | Value |
|---|---|
| March 31, 2026 | 467.65 |
| February 28, 2026 | 467.96 |
| January 31, 2026 | 466.01 |
| December 31, 2025 | 466.13 |
| November 30, 2025 | 465.13 |
| October 31, 2025 | 461.82 |
| September 30, 2025 | 460.82 |
| August 31, 2025 | 462.04 |
| July 31, 2025 | 458.50 |
| June 30, 2025 | 459.04 |
| May 31, 2025 | 461.57 |
| April 30, 2025 | 461.96 |
| March 31, 2025 | 465.48 |
| February 28, 2025 | 463.99 |
| January 31, 2025 | 463.64 |
| December 31, 2024 | 465.05 |
| November 30, 2024 | 463.45 |
| October 31, 2024 | 461.36 |
| September 30, 2024 | 457.69 |
| August 31, 2024 | 454.82 |
| July 31, 2024 | 453.99 |
| June 30, 2024 | 455.79 |
| May 31, 2024 | 453.78 |
| April 30, 2024 | 452.06 |
| March 31, 2024 | 450.61 |
| Date | Value |
|---|---|
| February 29, 2024 | 449.29 |
| January 31, 2024 | 444.63 |
| December 31, 2023 | 445.94 |
| November 30, 2023 | 444.04 |
| October 31, 2023 | 443.99 |
| September 30, 2023 | 443.03 |
| August 31, 2023 | 439.35 |
| July 31, 2023 | 438.56 |
| June 30, 2023 | 433.26 |
| May 31, 2023 | 430.25 |
| April 30, 2023 | 426.85 |
| March 31, 2023 | 425.65 |
| February 28, 2023 | 422.82 |
| January 31, 2023 | 423.17 |
| December 31, 2022 | 419.48 |
| November 30, 2022 | 418.59 |
| October 31, 2022 | 417.87 |
| September 30, 2022 | 416.38 |
| August 31, 2022 | 415.15 |
| July 31, 2022 | 416.52 |
| June 30, 2022 | 418.80 |
| May 31, 2022 | 415.98 |
| April 30, 2022 | 410.99 |
| March 31, 2022 | 403.97 |
| February 28, 2022 | 398.28 |
News
Headline
Time (ET)
06/03 07:13
05/28 12:00
05/15 07:05
05/14 12:00
05/14 07:24
05/07 12:00
Basic Info
|
South Atlantic Census Division House Price Index is at a current level of 467.65, down from 467.96 last month and up from 465.48 one year ago. This is a change of -0.07% from last month and 0.47% from one year ago. |
| Report | FHFA House Price Index |
| Category | House Prices |
| Region | United States |
| Source | Federal Housing Finance Agency |
Stats
| Last Value | 467.65 |
| Latest Period | Mar 2026 |
| Last Updated | May 26 2026, 09:02 EDT |
| Next Release | Jun 30 2026, 09:00 EDT |
| Average Growth Rate | 4.42% |
| Value from Last Month | 467.96 |
| Change from Last Month | -0.07% |
| Value from 1 Year Ago | 465.48 |
| Change from 1 Year Ago | 0.47% |
| Frequency | Monthly |
| Unit | Index January 1991=100 |
| Adjustment | Seasonally Adjusted |
| Download Source File |