

S&p Global Inc (SPGI) - Commodity Insights Operating Profit (I:SGIS6JXD)
Level Chart
Basic Info
|
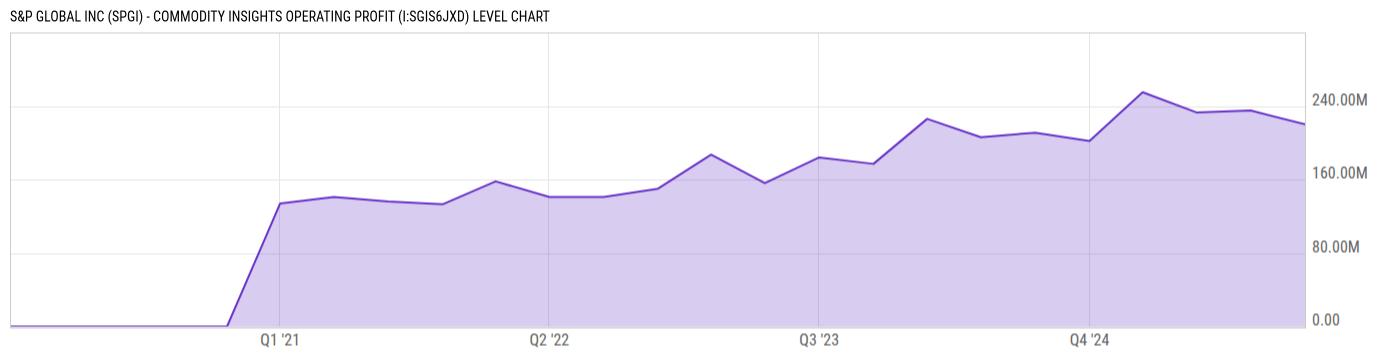
S&p Global Inc (SPGI) - Commodity Insights Operating Profit is at a current level of 220.00M, down from 235.00M last quarter and up from 202.00M one year ago. This is a change of -6.38% from last quarter and 8.91% from one year ago. |
|
S&p Global Inc Commodity Insights Operating Profit refers to the profit generated by the Commodity Insights division after deducting all operating expenses from its total revenue within a specific reporting period. |
| Report | Fiscal.ai |
| Category | Segments & KPIs |
| Region | United States |
| Source | Fiscal.ai |
|
Data provided via Fiscal.ai |
Stats
| Last Value | 220.00M |
| Latest Period | Dec 2025 |
| Last Updated | Mar 23 2026, 14:14 EDT |
| Next Release | Apr 15 2026, 08:30 EDT (E) |
| Average Growth Rate | 13.73% |
| Value from Last Quarter | 235.00M |
| Change from Last Quarter | -6.38% |
| Value from 1 Year Ago | 202.00M |
| Change from 1 Year Ago | 8.91% |
| Frequency | Quarterly |
| Unit | USD |
| Adjustment | N/A |
| Download Source File |
Historical Data
| Date | Value |
|---|---|
| December 31, 2025 | 220.00M |
| September 30, 2025 | 235.00M |
| June 30, 2025 | 233.00M |
| March 31, 2025 | 255.00M |
| December 31, 2024 | 202.00M |
| September 30, 2024 | 211.00M |
| June 30, 2024 | 206.00M |
| March 31, 2024 | 226.00M |
| December 31, 2023 | 177.00M |
| September 30, 2023 | 184.00M |
| June 30, 2023 | 156.00M |
| March 31, 2023 | 187.00M |
| December 31, 2022 | 150.00M |
| Date | Value |
|---|---|
| September 30, 2022 | 141.00M |
| June 30, 2022 | 141.00M |
| March 31, 2022 | 158.00M |
| December 31, 2021 | 133.00M |
| September 30, 2021 | 136.00M |
| June 30, 2021 | 141.00M |
| March 31, 2021 | 134.00M |
| December 31, 2020 | 0.00 |
| September 30, 2020 | 0.00 |
| June 30, 2020 | 0.00 |
| March 31, 2020 | 0.00 |
| December 31, 2019 | 0.00 |
News
Basic Info
|
S&p Global Inc (SPGI) - Commodity Insights Operating Profit is at a current level of 220.00M, down from 235.00M last quarter and up from 202.00M one year ago. This is a change of -6.38% from last quarter and 8.91% from one year ago. |
|
S&p Global Inc Commodity Insights Operating Profit refers to the profit generated by the Commodity Insights division after deducting all operating expenses from its total revenue within a specific reporting period. |
| Report | Fiscal.ai |
| Category | Segments & KPIs |
| Region | United States |
| Source | Fiscal.ai |
|
Data provided via Fiscal.ai |
Stats
| Last Value | 220.00M |
| Latest Period | Dec 2025 |
| Last Updated | Mar 23 2026, 14:14 EDT |
| Next Release | Apr 15 2026, 08:30 EDT (E) |
| Average Growth Rate | 13.73% |
| Value from Last Quarter | 235.00M |
| Change from Last Quarter | -6.38% |
| Value from 1 Year Ago | 202.00M |
| Change from 1 Year Ago | 8.91% |
| Frequency | Quarterly |
| Unit | USD |
| Adjustment | N/A |
| Download Source File |
Related Securities
Related Indicators
| S&p Global Inc (SPGI) - Mobility Operating Profit | 71.00M USD |
| S&p Global Inc (SPGI) - Mobility Revenue | 444.00M USD |
| S&p Global Inc (SPGI) - Ratings Operating Profit | 723.00M USD |
| S&p Global Inc (SPGI) - Ratings Revenue | 1.187B USD |