

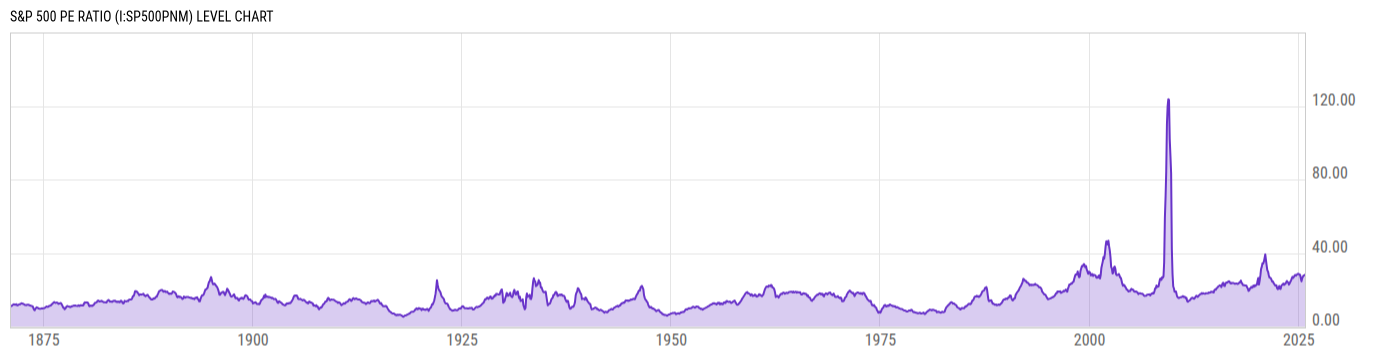
S&P 500 PE Ratio (I:SP500PNM)
28.13 for Sep 2025
Level Chart
Basic Info
|
S&P 500 PE Ratio is at a current level of 28.13, up from 27.84 last month and up from 28.09 one year ago. This is a change of 1.04% from last month and 0.14% from one year ago. |
|
Price to earnings ratio, based on trailing twelve month “as reported” earnings. |
| Report | S&P 500 |
| Categories | N/A |
| Region | United States |
| Source | Multpl |
Stats
| Last Value | 28.13 |
| Latest Period | Sep 2025 |
| Last Updated | May 6 2026, 16:22 EDT |
| Next Release | Jul 1 2026, 19:00 EDT |
| Average Growth Rate | 2.16% |
| Value from Last Month | 27.84 |
| Change from Last Month | 1.04% |
| Value from 1 Year Ago | 28.09 |
| Change from 1 Year Ago | 0.14% |
| Frequency | Monthly |
| Adjustment | N/A |
| Download Source File |
Historical Data
| Date | Value |
|---|---|
| September 30, 2025 | 28.13 |
| August 31, 2025 | 27.84 |
| July 31, 2025 | 27.81 |
| June 30, 2025 | 27.10 |
| May 31, 2025 | 26.34 |
| April 30, 2025 | 24.56 |
| March 31, 2025 | 26.23 |
| February 28, 2025 | 28.15 |
| January 31, 2025 | 28.16 |
| December 31, 2024 | 28.60 |
| November 30, 2024 | 28.66 |
| October 31, 2024 | 28.45 |
| September 30, 2024 | 28.09 |
| August 31, 2024 | 27.67 |
| July 31, 2024 | 28.08 |
| June 30, 2024 | 27.64 |
| May 31, 2024 | 26.93 |
| April 30, 2024 | 26.41 |
| March 31, 2024 | 27.02 |
| February 29, 2024 | 26.14 |
| January 31, 2024 | 25.01 |
| December 31, 2023 | 24.35 |
| November 30, 2023 | 23.51 |
| October 31, 2023 | 22.78 |
| September 30, 2023 | 23.93 |
| Date | Value |
|---|---|
| August 31, 2023 | 24.16 |
| July 31, 2023 | 24.76 |
| June 30, 2023 | 24.01 |
| May 31, 2023 | 23.15 |
| April 30, 2023 | 23.27 |
| March 31, 2023 | 22.66 |
| February 28, 2023 | 23.40 |
| January 31, 2023 | 22.82 |
| December 31, 2022 | 22.65 |
| November 30, 2022 | 22.07 |
| October 31, 2022 | 20.44 |
| September 30, 2022 | 20.58 |
| August 31, 2022 | 22.03 |
| July 31, 2022 | 20.53 |
| June 30, 2022 | 20.28 |
| May 31, 2022 | 20.81 |
| April 30, 2022 | 22.40 |
| March 31, 2022 | 22.19 |
| February 28, 2022 | 22.42 |
| January 31, 2022 | 23.11 |
| December 31, 2021 | 23.63 |
| November 30, 2021 | 24.52 |
| October 31, 2021 | 24.39 |
| September 30, 2021 | 25.35 |
| August 31, 2021 | 26.23 |
News
Headline
Time (ET)
06/01 12:12
05/14 17:07
05/05 16:38
Basic Info
|
S&P 500 PE Ratio is at a current level of 28.13, up from 27.84 last month and up from 28.09 one year ago. This is a change of 1.04% from last month and 0.14% from one year ago. |
|
Price to earnings ratio, based on trailing twelve month “as reported” earnings. |
| Report | S&P 500 |
| Categories | N/A |
| Region | United States |
| Source | Multpl |
Stats
| Last Value | 28.13 |
| Latest Period | Sep 2025 |
| Last Updated | May 6 2026, 16:22 EDT |
| Next Release | Jul 1 2026, 19:00 EDT |
| Average Growth Rate | 2.16% |
| Value from Last Month | 27.84 |
| Change from Last Month | 1.04% |
| Value from 1 Year Ago | 28.09 |
| Change from 1 Year Ago | 0.14% |
| Frequency | Monthly |
| Adjustment | N/A |
| Download Source File |