

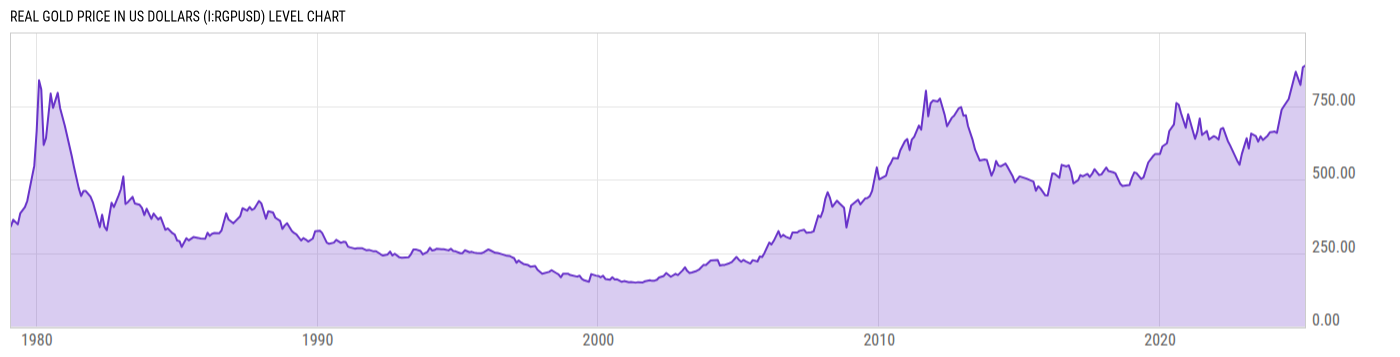
Real Gold Price in US Dollars (I:RGPUSD)
886.70 USD/oz t for Feb 2025
Level Chart
Basic Info
|
Real Gold Price in US Dollars is at a current level of 886.70, up from 881.64 last month and up from 658.62 one year ago. This is a change of 0.57% from last month and 34.63% from one year ago. |
| Report | Gold Prices |
| Category | Metals |
| Region | United States |
| Source | Gold Council |
Stats
| Last Value | 886.70 |
| Latest Period | Feb 2025 |
| Last Updated | May 12 2026, 08:36 EDT |
| Average Growth Rate | 5.15% |
| Value from Last Month | 881.64 |
| Change from Last Month | 0.57% |
| Value from 1 Year Ago | 658.62 |
| Change from 1 Year Ago | 34.63% |
| Frequency | Monthly |
| Unit | USD per Troy Ounce |
| Adjustment | N/A |
| Notes | Gold Price in US Dollars divided by US Consumer Price Index. |
| Formula | Gold Price in US Dollars (DISCONTINUED) * 100.00 / US Consumer Price Index |
Historical Data
| Date | Value |
|---|---|
| February 28, 2025 | 886.70 |
| January 31, 2025 | 881.64 |
| December 31, 2024 | 821.49 |
| October 31, 2024 | 866.26 |
| September 30, 2024 | 835.63 |
| July 31, 2024 | 773.77 |
| May 31, 2024 | 749.84 |
| April 30, 2024 | 737.01 |
| February 29, 2024 | 658.62 |
| January 31, 2024 | 663.00 |
| November 30, 2023 | 660.69 |
| October 31, 2023 | 649.08 |
| August 31, 2023 | 634.45 |
| July 31, 2023 | 646.95 |
| June 30, 2023 | 628.84 |
| May 31, 2023 | 647.64 |
| March 31, 2023 | 656.31 |
| February 28, 2023 | 605.22 |
| January 31, 2023 | 640.33 |
| November 30, 2022 | 587.15 |
| October 31, 2022 | 550.25 |
| September 30, 2022 | 564.15 |
| August 31, 2022 | 581.25 |
| June 30, 2022 | 615.94 |
| May 31, 2022 | 631.08 |
| Date | Value |
|---|---|
| March 31, 2022 | 675.42 |
| February 28, 2022 | 671.24 |
| January 31, 2022 | 635.75 |
| December 31, 2021 | 642.93 |
| November 30, 2021 | 647.41 |
| September 30, 2021 | 635.99 |
| August 31, 2021 | 665.12 |
| June 30, 2021 | 651.69 |
| May 31, 2021 | 707.78 |
| April 30, 2021 | 662.88 |
| March 31, 2021 | 638.36 |
| December 31, 2020 | 721.66 |
| November 30, 2020 | 676.05 |
| September 30, 2020 | 725.20 |
| August 31, 2020 | 754.06 |
| July 31, 2020 | 759.99 |
| June 30, 2020 | 687.40 |
| April 30, 2020 | 664.91 |
| March 31, 2020 | 623.24 |
| January 31, 2020 | 612.41 |
| December 31, 2019 | 586.67 |
| October 31, 2019 | 587.05 |
| September 30, 2019 | 578.99 |
| July 31, 2019 | 557.82 |
| May 31, 2019 | 507.34 |
News
Headline
Time (ET)
05/27 14:00
05/26 14:00
05/22 14:00
Basic Info
|
Real Gold Price in US Dollars is at a current level of 886.70, up from 881.64 last month and up from 658.62 one year ago. This is a change of 0.57% from last month and 34.63% from one year ago. |
| Report | Gold Prices |
| Category | Metals |
| Region | United States |
| Source | Gold Council |
Stats
| Last Value | 886.70 |
| Latest Period | Feb 2025 |
| Last Updated | May 12 2026, 08:36 EDT |
| Average Growth Rate | 5.15% |
| Value from Last Month | 881.64 |
| Change from Last Month | 0.57% |
| Value from 1 Year Ago | 658.62 |
| Change from 1 Year Ago | 34.63% |
| Frequency | Monthly |
| Unit | USD per Troy Ounce |
| Adjustment | N/A |
| Notes | Gold Price in US Dollars divided by US Consumer Price Index. |
| Formula | Gold Price in US Dollars (DISCONTINUED) * 100.00 / US Consumer Price Index |