

Quebec Clothing and Clothing Accessories Stores Retail Sales (DISCONTINUED) (I:QCCASRS)
973.73M CAD for Dec 2022
Level Chart
Basic Info
|
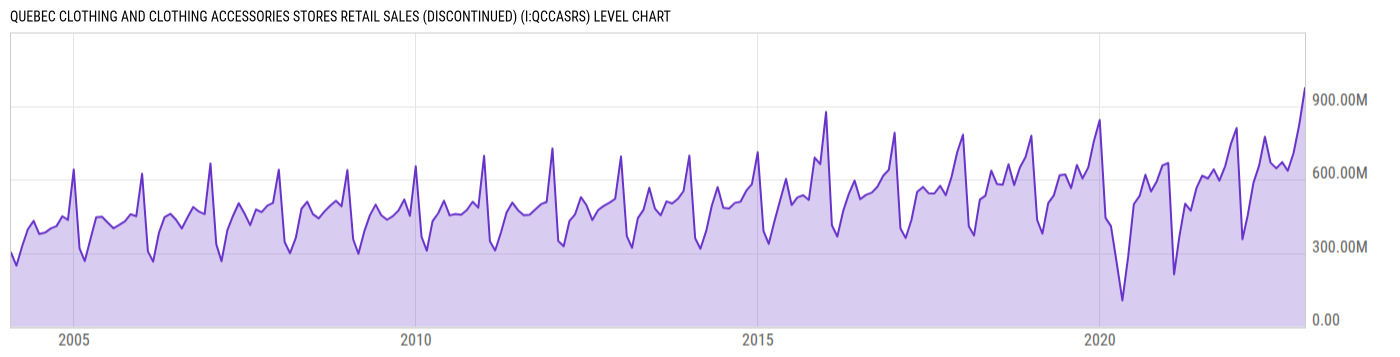
Quebec Clothing and Clothing Accessories Stores Retail Sales is at a current level of 973.73M, up from 822.24M last month and up from 810.22M one year ago. This is a change of 18.42% from last month and 20.18% from one year ago. |
| Report | Canada Retail Trade |
| Category | Retail and Services Business Statistics |
| Region | Quebec |
| Source | Statistics Canada |
Stats
| Last Value | 973.73M |
| Latest Period | Dec 2022 |
| Last Updated | Feb 21 2023, 15:23 EST |
| Average Growth Rate | 45.93% |
| Value from Last Month | 822.24M |
| Change from Last Month | 18.42% |
| Value from 1 Year Ago | 810.22M |
| Change from 1 Year Ago | 20.18% |
| Frequency | Monthly |
| Unit | CAD |
| Adjustment | Not Seasonally Adjusted |
| Download Source File |
Historical Data
| Date | Value |
|---|---|
| December 31, 2022 | 973.73M |
| November 30, 2022 | 822.24M |
| October 31, 2022 | 708.40M |
| September 30, 2022 | 635.67M |
| August 31, 2022 | 671.07M |
| July 31, 2022 | 645.39M |
| June 30, 2022 | 669.03M |
| May 31, 2022 | 774.66M |
| April 30, 2022 | 656.58M |
| March 31, 2022 | 587.25M |
| February 28, 2022 | 453.25M |
| January 31, 2022 | 355.98M |
| December 31, 2021 | 810.22M |
| November 30, 2021 | 744.14M |
| October 31, 2021 | 654.94M |
| September 30, 2021 | 595.16M |
| August 31, 2021 | 641.27M |
| July 31, 2021 | 604.11M |
| June 30, 2021 | 615.23M |
| May 31, 2021 | 565.89M |
| April 30, 2021 | 472.72M |
| March 31, 2021 | 501.45M |
| February 28, 2021 | 365.66M |
| January 31, 2021 | 212.82M |
| December 31, 2020 | 667.38M |
| Date | Value |
|---|---|
| November 30, 2020 | 657.60M |
| October 31, 2020 | 593.15M |
| September 30, 2020 | 551.27M |
| August 31, 2020 | 619.38M |
| July 31, 2020 | 532.90M |
| June 30, 2020 | 498.82M |
| May 31, 2020 | 286.06M |
| April 30, 2020 | 106.43M |
| March 31, 2020 | 258.27M |
| February 29, 2020 | 409.55M |
| January 31, 2020 | 443.41M |
| December 31, 2019 | 842.96M |
| November 30, 2019 | 757.51M |
| October 31, 2019 | 649.60M |
| September 30, 2019 | 604.25M |
| August 31, 2019 | 659.35M |
| July 31, 2019 | 564.78M |
| June 30, 2019 | 620.35M |
| May 31, 2019 | 617.62M |
| April 30, 2019 | 535.20M |
| March 31, 2019 | 503.40M |
| February 28, 2019 | 378.93M |
| January 31, 2019 | 434.72M |
| December 31, 2018 | 778.75M |
| November 30, 2018 | 692.17M |
News
Headline
Time (ET)
05/25 08:54
05/22 08:46
05/04 09:46
Basic Info
|
Quebec Clothing and Clothing Accessories Stores Retail Sales is at a current level of 973.73M, up from 822.24M last month and up from 810.22M one year ago. This is a change of 18.42% from last month and 20.18% from one year ago. |
| Report | Canada Retail Trade |
| Category | Retail and Services Business Statistics |
| Region | Quebec |
| Source | Statistics Canada |
Stats
| Last Value | 973.73M |
| Latest Period | Dec 2022 |
| Last Updated | Feb 21 2023, 15:23 EST |
| Average Growth Rate | 45.93% |
| Value from Last Month | 822.24M |
| Change from Last Month | 18.42% |
| Value from 1 Year Ago | 810.22M |
| Change from 1 Year Ago | 20.18% |
| Frequency | Monthly |
| Unit | CAD |
| Adjustment | Not Seasonally Adjusted |
| Download Source File |