

Qatar Crude Oil Production (I:QCOP)
1.275M bbl/d for Jan 2026
Level Chart
Basic Info
|
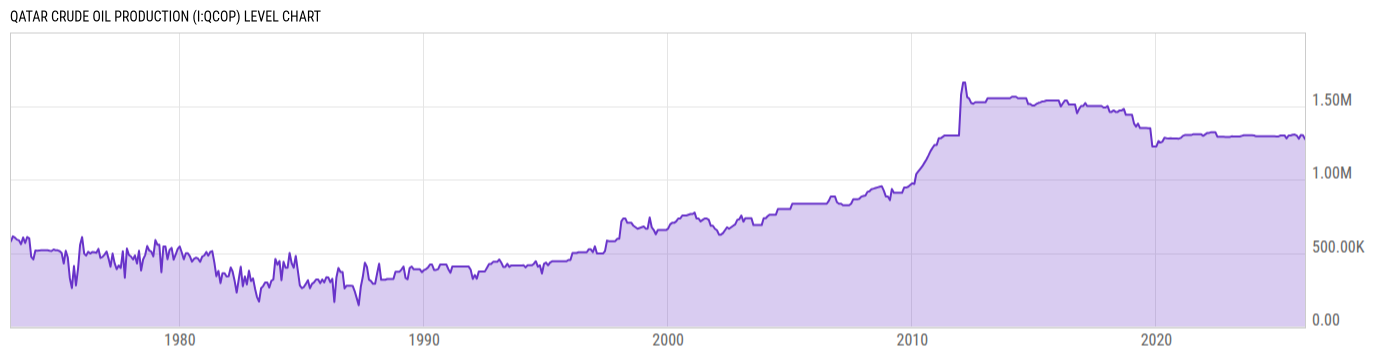
Qatar Crude Oil Production is at a current level of 1.275M, down from 1.301M last month and down from 1.299M one year ago. This is a change of -2.01% from last month and -1.83% from one year ago. |
| Report | International Energy Statistics |
| Category | Energy |
| Region | Qatar |
| Source | Energy Information Administration |
Stats
| Last Value | 1.275M |
| Latest Period | Jan 2026 |
| Last Updated | May 26 2026, 14:41 EDT |
| Next Release | Jun 25 2026, 14:00 EDT (E) |
| Average Growth Rate | 8.11% |
| Value from Last Month | 1.301M |
| Change from Last Month | -2.01% |
| Value from 1 Year Ago | 1.299M |
| Change from 1 Year Ago | -1.83% |
| Frequency | Monthly |
| Unit | Barrels per Day |
| Adjustment | N/A |
| Download Source File |
Historical Data
| Date | Value |
|---|---|
| January 31, 2026 | 1.275M |
| December 31, 2025 | 1.301M |
| November 30, 2025 | 1.303M |
| October 31, 2025 | 1.278M |
| September 30, 2025 | 1.299M |
| August 31, 2025 | 1.306M |
| July 31, 2025 | 1.304M |
| June 30, 2025 | 1.299M |
| May 31, 2025 | 1.300M |
| April 30, 2025 | 1.280M |
| March 31, 2025 | 1.300M |
| February 28, 2025 | 1.300M |
| January 31, 2025 | 1.299M |
| December 31, 2024 | 1.293M |
| November 30, 2024 | 1.293M |
| October 31, 2024 | 1.293M |
| September 30, 2024 | 1.293M |
| August 31, 2024 | 1.293M |
| July 31, 2024 | 1.293M |
| June 30, 2024 | 1.294M |
| May 31, 2024 | 1.294M |
| April 30, 2024 | 1.294M |
| March 31, 2024 | 1.294M |
| February 29, 2024 | 1.294M |
| January 31, 2024 | 1.294M |
| Date | Value |
|---|---|
| December 31, 2023 | 1.299M |
| November 30, 2023 | 1.300M |
| October 31, 2023 | 1.300M |
| September 30, 2023 | 1.300M |
| August 31, 2023 | 1.300M |
| July 31, 2023 | 1.300M |
| June 30, 2023 | 1.297M |
| May 31, 2023 | 1.292M |
| April 30, 2023 | 1.293M |
| March 31, 2023 | 1.293M |
| February 28, 2023 | 1.293M |
| January 31, 2023 | 1.294M |
| December 31, 2022 | 1.289M |
| November 30, 2022 | 1.289M |
| October 31, 2022 | 1.290M |
| September 30, 2022 | 1.290M |
| August 31, 2022 | 1.290M |
| July 31, 2022 | 1.291M |
| June 30, 2022 | 1.291M |
| May 31, 2022 | 1.322M |
| April 30, 2022 | 1.322M |
| March 31, 2022 | 1.322M |
| February 28, 2022 | 1.317M |
| January 31, 2022 | 1.317M |
| December 31, 2021 | 1.307M |
News
Headline
Time (ET)
05/22 15:56
05/12 15:59
Basic Info
|
Qatar Crude Oil Production is at a current level of 1.275M, down from 1.301M last month and down from 1.299M one year ago. This is a change of -2.01% from last month and -1.83% from one year ago. |
| Report | International Energy Statistics |
| Category | Energy |
| Region | Qatar |
| Source | Energy Information Administration |
Stats
| Last Value | 1.275M |
| Latest Period | Jan 2026 |
| Last Updated | May 26 2026, 14:41 EDT |
| Next Release | Jun 25 2026, 14:00 EDT (E) |
| Average Growth Rate | 8.11% |
| Value from Last Month | 1.301M |
| Change from Last Month | -2.01% |
| Value from 1 Year Ago | 1.299M |
| Change from 1 Year Ago | -1.83% |
| Frequency | Monthly |
| Unit | Barrels per Day |
| Adjustment | N/A |
| Download Source File |