

Providence-Warwick, RI-MA Housing Affordability Index (DISCONTINUED) (I:PWRIMAHA)
104.20 for 2022
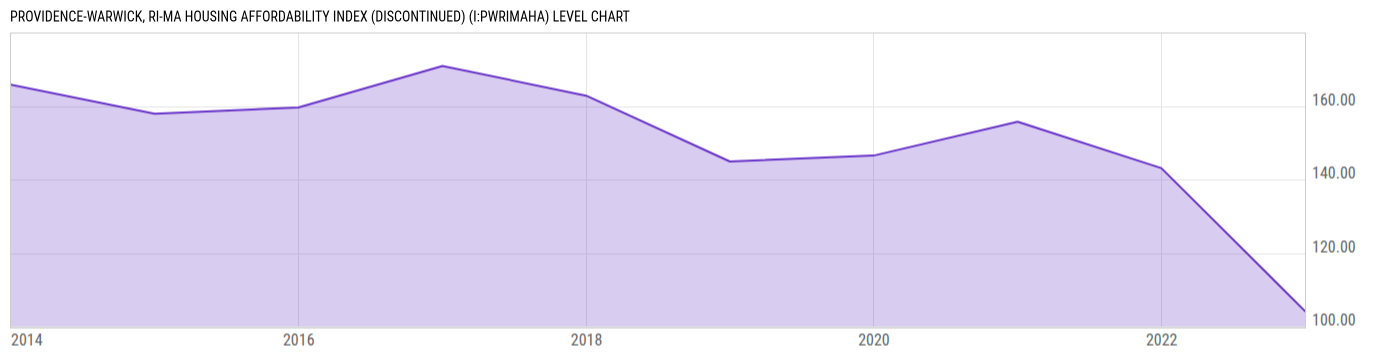
Level Chart
Basic Info
|
Providence-Warwick, RI-MA Housing Affordability Index is at a current level of 104.20, down from 143.10 one year ago. This is a change of -27.18% from one year ago. |
| Report | Quarterly Report on Housing Affordability |
| Category | House Prices |
| Region | N/A |
| Source | National Association of Realtors |
Stats
| Last Value | 104.20 |
| Latest Period | 2022 |
| Last Updated | Aug 10 2023, 10:10 EDT |
| Average Growth Rate | -4.47% |
| Value from 1 Year Ago | 143.10 |
| Change from 1 Year Ago | -27.18% |
| Frequency | Yearly |
| Adjustment | Not Seasonally Adjusted |
| Download Source File |
Historical Data
| Date | Value |
|---|---|
| December 31, 2022 | 104.20 |
| December 31, 2021 | 143.10 |
| December 31, 2020 | 155.70 |
| December 31, 2019 | 146.50 |
| December 31, 2018 | 144.90 |
| Date | Value |
|---|---|
| December 31, 2017 | 162.80 |
| December 31, 2016 | 170.90 |
| December 31, 2015 | 159.60 |
| December 31, 2014 | 157.90 |
| December 31, 2013 | 165.80 |
News
Headline
Time (ET)
05/19 15:28
05/15 07:05
Basic Info
|
Providence-Warwick, RI-MA Housing Affordability Index is at a current level of 104.20, down from 143.10 one year ago. This is a change of -27.18% from one year ago. |
| Report | Quarterly Report on Housing Affordability |
| Category | House Prices |
| Region | N/A |
| Source | National Association of Realtors |
Stats
| Last Value | 104.20 |
| Latest Period | 2022 |
| Last Updated | Aug 10 2023, 10:10 EDT |
| Average Growth Rate | -4.47% |
| Value from 1 Year Ago | 143.10 |
| Change from 1 Year Ago | -27.18% |
| Frequency | Yearly |
| Adjustment | Not Seasonally Adjusted |
| Download Source File |