

Prologis Inc (PLD) - Development Management & Other Revenue (I:PIPLDDNQ)
Level Chart
Basic Info
|
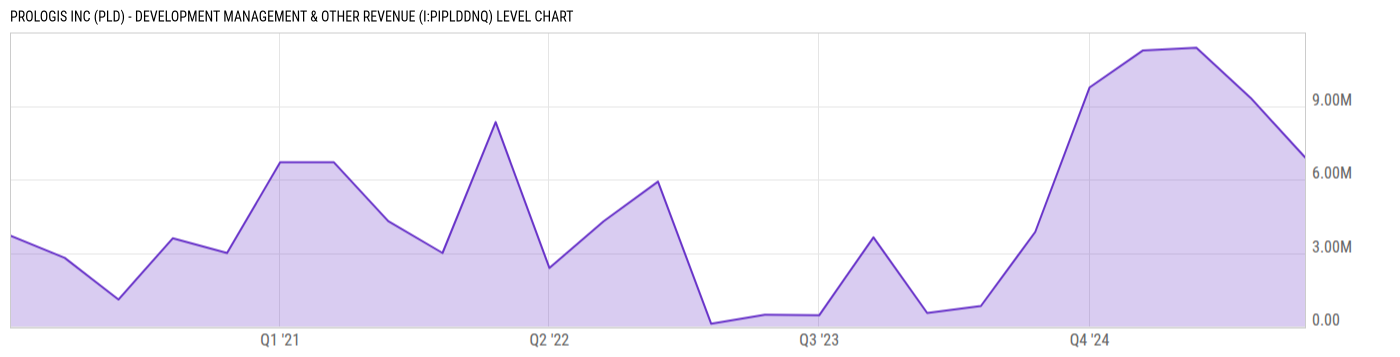
Prologis Inc (PLD) - Development Management & Other Revenue is at a current level of 6.904M, down from 9.33M last quarter and down from 9.753M one year ago. This is a change of -26.00% from last quarter and -29.21% from one year ago. |
|
Development Management & Other Revenue data set provides an analysis of the revenue generated by Prologis Inc's development management and other related services. This data set focuses on tracking and evaluating the financial performance of Prologis' development projects, construction management activities, and other ancillary services provided to its clients. By examining the Development Management & Other Revenue data, investors, analysts, and industry professionals can gain insights into Prologis' revenue from development fees, project management services, and other value-added offerings in the real estate sector. |
| Report | Fiscal.ai |
| Category | Segments & KPIs |
| Region | United States |
| Source | Fiscal.ai |
|
Data provided via Fiscal.ai |
Stats
| Last Value | 6.904M |
| Latest Period | Dec 2025 |
| Last Updated | Mar 23 2026, 14:14 EDT |
| Next Release | Jul 15 2026, 08:30 EDT (E) |
| Average Growth Rate | 294.9% |
| Value from Last Quarter | 9.33M |
| Change from Last Quarter | -26.00% |
| Value from 1 Year Ago | 9.753M |
| Change from 1 Year Ago | -29.21% |
| Frequency | Quarterly |
| Unit | USD |
| Adjustment | N/A |
| Download Source File |
Historical Data
| Date | Value |
|---|---|
| December 31, 2025 | 6.904M |
| September 30, 2025 | 9.33M |
| June 30, 2025 | 11.38M |
| March 31, 2025 | 11.26M |
| December 31, 2024 | 9.753M |
| September 30, 2024 | 3.858M |
| June 30, 2024 | 836000.0 |
| March 31, 2024 | 551000.0 |
| December 31, 2023 | 3.64M |
| September 30, 2023 | 457000.0 |
| June 30, 2023 | 482000.0 |
| March 31, 2023 | 116000.0 |
| December 31, 2022 | 5.911M |
| Date | Value |
|---|---|
| September 30, 2022 | 4.294M |
| June 30, 2022 | 2.389M |
| March 31, 2022 | 8.342M |
| December 31, 2021 | 3.00M |
| September 30, 2021 | 4.30M |
| June 30, 2021 | 6.70M |
| March 31, 2021 | 6.70M |
| December 31, 2020 | 3.00M |
| September 30, 2020 | 3.60M |
| June 30, 2020 | 1.10M |
| March 31, 2020 | 2.80M |
| December 31, 2019 | 3.70M |
News
Basic Info
|
Prologis Inc (PLD) - Development Management & Other Revenue is at a current level of 6.904M, down from 9.33M last quarter and down from 9.753M one year ago. This is a change of -26.00% from last quarter and -29.21% from one year ago. |
|
Development Management & Other Revenue data set provides an analysis of the revenue generated by Prologis Inc's development management and other related services. This data set focuses on tracking and evaluating the financial performance of Prologis' development projects, construction management activities, and other ancillary services provided to its clients. By examining the Development Management & Other Revenue data, investors, analysts, and industry professionals can gain insights into Prologis' revenue from development fees, project management services, and other value-added offerings in the real estate sector. |
| Report | Fiscal.ai |
| Category | Segments & KPIs |
| Region | United States |
| Source | Fiscal.ai |
|
Data provided via Fiscal.ai |
Stats
| Last Value | 6.904M |
| Latest Period | Dec 2025 |
| Last Updated | Mar 23 2026, 14:14 EDT |
| Next Release | Jul 15 2026, 08:30 EDT (E) |
| Average Growth Rate | 294.9% |
| Value from Last Quarter | 9.33M |
| Change from Last Quarter | -26.00% |
| Value from 1 Year Ago | 9.753M |
| Change from 1 Year Ago | -29.21% |
| Frequency | Quarterly |
| Unit | USD |
| Adjustment | N/A |
| Download Source File |
Related Securities
Related Indicators
| Prologis Inc (PLD) - Period-End Occupancy Rate | 95.80% |
| Prologis Inc (PLD) - Rental Revenue | 8.159B USD |
| Prologis Inc (PLD) - Rental Revenue | 2.092B USD |
| Prologis Inc (PLD) - Strategic Capital Revenue | 592.35M USD |
| Prologis Inc (PLD) - Strategic Capital Revenue | 153.70M USD |