

Precious Metals Price Index (I:PMPI)
383.18 for Mar 2026
Level Chart
Basic Info
|
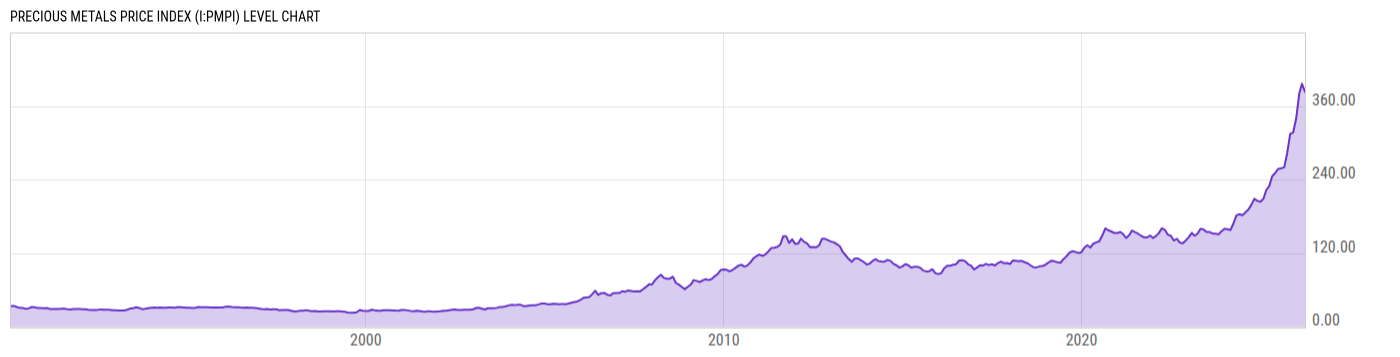
Precious Metals Price Index is at a current level of 383.18, down from 396.32 last month and up from 229.22 one year ago. This is a change of -3.32% from last month and 67.17% from one year ago. |
| Report | IMF Primary Commodity Prices |
| Categories | Agriculture and Livestock , Chemicals , Metals |
| Region | N/A |
| Source | International Monetary Fund |
Stats
| Last Value | 383.18 |
| Latest Period | Mar 2026 |
| Last Updated | May 6 2026, 11:11 EDT |
| Next Release | Jun 3 2026, 08:00 EDT (E) |
| Average Growth Rate | 7.57% |
| Value from Last Month | 396.32 |
| Change from Last Month | -3.32% |
| Value from 1 Year Ago | 229.22 |
| Change from 1 Year Ago | 67.17% |
| Frequency | Monthly |
| Unit | Index 2016=100 |
| Adjustment | N/A |
| Download Source File | |
| Notes | Precious Metals Price Index includes Gold, Silver, Palladium and Platinum Price Indices |
Historical Data
| Date | Value |
|---|---|
| March 31, 2026 | 383.18 |
| February 28, 2026 | 396.32 |
| January 31, 2026 | 379.94 |
| December 31, 2025 | 339.51 |
| November 30, 2025 | 316.65 |
| October 31, 2025 | 314.34 |
| September 30, 2025 | 282.93 |
| August 31, 2025 | 259.74 |
| July 31, 2025 | 258.33 |
| June 30, 2025 | 257.29 |
| May 31, 2025 | 250.54 |
| April 30, 2025 | 245.37 |
| March 31, 2025 | 229.22 |
| February 28, 2025 | 222.46 |
| January 31, 2025 | 208.47 |
| December 31, 2024 | 203.73 |
| November 30, 2024 | 205.15 |
| October 31, 2024 | 208.57 |
| September 30, 2024 | 198.96 |
| August 31, 2024 | 190.94 |
| July 31, 2024 | 186.36 |
| June 30, 2024 | 181.55 |
| May 31, 2024 | 183.35 |
| April 30, 2024 | 181.41 |
| March 31, 2024 | 168.21 |
| Date | Value |
|---|---|
| February 29, 2024 | 157.54 |
| January 31, 2024 | 158.66 |
| December 31, 2023 | 159.54 |
| November 30, 2023 | 155.57 |
| October 31, 2023 | 150.48 |
| September 30, 2023 | 151.41 |
| August 31, 2023 | 151.81 |
| July 31, 2023 | 154.33 |
| June 30, 2023 | 154.17 |
| May 31, 2023 | 158.51 |
| April 30, 2023 | 159.53 |
| March 31, 2023 | 151.81 |
| February 28, 2023 | 148.04 |
| January 31, 2023 | 152.78 |
| December 31, 2022 | 145.81 |
| November 30, 2022 | 140.51 |
| October 31, 2022 | 136.06 |
| September 30, 2022 | 137.06 |
| August 31, 2022 | 143.26 |
| July 31, 2022 | 140.33 |
| June 30, 2022 | 148.24 |
| May 31, 2022 | 149.93 |
| April 30, 2022 | 157.89 |
| March 31, 2022 | 160.43 |
| February 28, 2022 | 152.44 |
News
Headline
Time (ET)
05/22 07:41
05/13 17:00
05/12 15:51
Basic Info
|
Precious Metals Price Index is at a current level of 383.18, down from 396.32 last month and up from 229.22 one year ago. This is a change of -3.32% from last month and 67.17% from one year ago. |
| Report | IMF Primary Commodity Prices |
| Categories | Agriculture and Livestock , Chemicals , Metals |
| Region | N/A |
| Source | International Monetary Fund |
Stats
| Last Value | 383.18 |
| Latest Period | Mar 2026 |
| Last Updated | May 6 2026, 11:11 EDT |
| Next Release | Jun 3 2026, 08:00 EDT (E) |
| Average Growth Rate | 7.57% |
| Value from Last Month | 396.32 |
| Change from Last Month | -3.32% |
| Value from 1 Year Ago | 229.22 |
| Change from 1 Year Ago | 67.17% |
| Frequency | Monthly |
| Unit | Index 2016=100 |
| Adjustment | N/A |
| Download Source File | |
| Notes | Precious Metals Price Index includes Gold, Silver, Palladium and Platinum Price Indices |