

Philly Fed US Leading Index (DISCONTINUED) (I:PFUSLI)
1.72% for Feb 2020
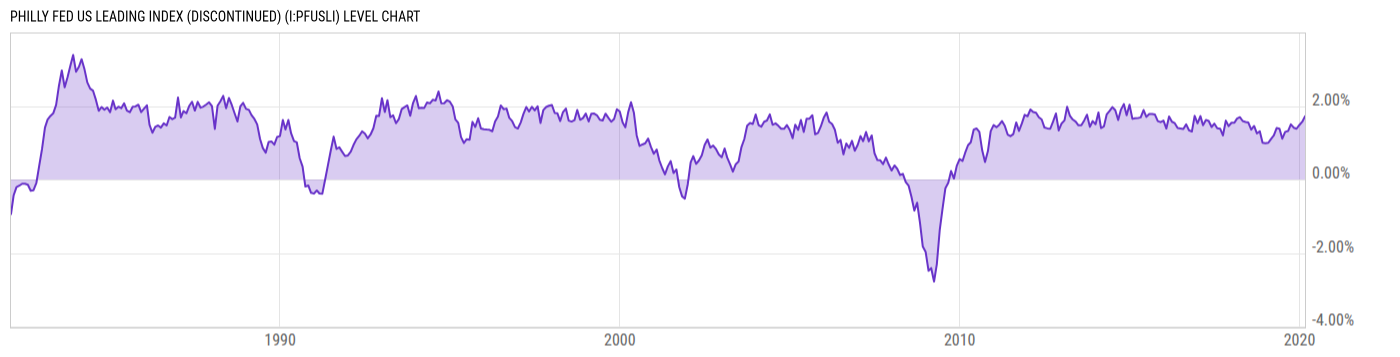
Level Chart
Basic Info
|
Philly Fed US Leading Index is at 1.72%, compared to 1.57% last month and 1.10% last year. This is higher than the long term average of 1.30%. |
| Report | Philly Fed Leading Index |
| Category | Economic Sentiment, Outlook and Activity |
| Region | United States |
| Source | Federal Reserve Bank of Philadelphia |
Stats
| Last Value | 1.72% |
| Latest Period | Feb 2020 |
| Last Updated | Apr 14 2020, 10:01 EDT |
| Long Term Average | 1.30% |
| Average Growth Rate | -122.3% |
| Value from Last Month | 1.57% |
| Change from Last Month | 9.25% |
| Value from 1 Year Ago | 1.10% |
| Change from 1 Year Ago | 56.13% |
| Frequency | Monthly |
| Unit | Percent |
| Adjustment | N/A |
| Download Source File | |
| Notes | This index is a 6 month prediction of the coincident index growth rate. |
Historical Data
| Date | Value |
|---|---|
| February 29, 2020 | 1.72% |
| January 31, 2020 | 1.57% |
| December 31, 2019 | 1.48% |
| November 30, 2019 | 1.38% |
| October 31, 2019 | 1.41% |
| September 30, 2019 | 1.50% |
| August 31, 2019 | 1.32% |
| July 31, 2019 | 1.30% |
| June 30, 2019 | 1.11% |
| May 31, 2019 | 1.38% |
| April 30, 2019 | 1.40% |
| March 31, 2019 | 1.20% |
| February 28, 2019 | 1.10% |
| January 31, 2019 | 1.00% |
| December 31, 2018 | 0.99% |
| November 30, 2018 | 1.00% |
| October 31, 2018 | 1.31% |
| September 30, 2018 | 1.25% |
| August 31, 2018 | 1.46% |
| July 31, 2018 | 1.36% |
| June 30, 2018 | 1.55% |
| May 31, 2018 | 1.57% |
| April 30, 2018 | 1.59% |
| March 31, 2018 | 1.69% |
| February 28, 2018 | 1.66% |
| Date | Value |
|---|---|
| January 31, 2018 | 1.55% |
| December 31, 2017 | 1.54% |
| November 30, 2017 | 1.45% |
| October 31, 2017 | 1.60% |
| September 30, 2017 | 1.20% |
| August 31, 2017 | 1.38% |
| July 31, 2017 | 1.40% |
| June 30, 2017 | 1.52% |
| May 31, 2017 | 1.43% |
| April 30, 2017 | 1.59% |
| March 31, 2017 | 1.62% |
| February 28, 2017 | 1.47% |
| January 31, 2017 | 1.72% |
| December 31, 2016 | 1.53% |
| November 30, 2016 | 1.73% |
| October 31, 2016 | 1.30% |
| September 30, 2016 | 1.34% |
| August 31, 2016 | 1.50% |
| July 31, 2016 | 1.37% |
| June 30, 2016 | 1.39% |
| May 31, 2016 | 1.40% |
| April 30, 2016 | 1.53% |
| March 31, 2016 | 1.57% |
| February 29, 2016 | 1.71% |
| January 31, 2016 | 1.39% |
News
Headline
Time (ET)
05/27 07:33
Basic Info
|
Philly Fed US Leading Index is at 1.72%, compared to 1.57% last month and 1.10% last year. This is higher than the long term average of 1.30%. |
| Report | Philly Fed Leading Index |
| Category | Economic Sentiment, Outlook and Activity |
| Region | United States |
| Source | Federal Reserve Bank of Philadelphia |
Stats
| Last Value | 1.72% |
| Latest Period | Feb 2020 |
| Last Updated | Apr 14 2020, 10:01 EDT |
| Long Term Average | 1.30% |
| Average Growth Rate | -122.3% |
| Value from Last Month | 1.57% |
| Change from Last Month | 9.25% |
| Value from 1 Year Ago | 1.10% |
| Change from 1 Year Ago | 56.13% |
| Frequency | Monthly |
| Unit | Percent |
| Adjustment | N/A |
| Download Source File | |
| Notes | This index is a 6 month prediction of the coincident index growth rate. |