

Philly Fed New Jersey Coincident Index (I:PFNJCI)
144.11 for Feb 2026
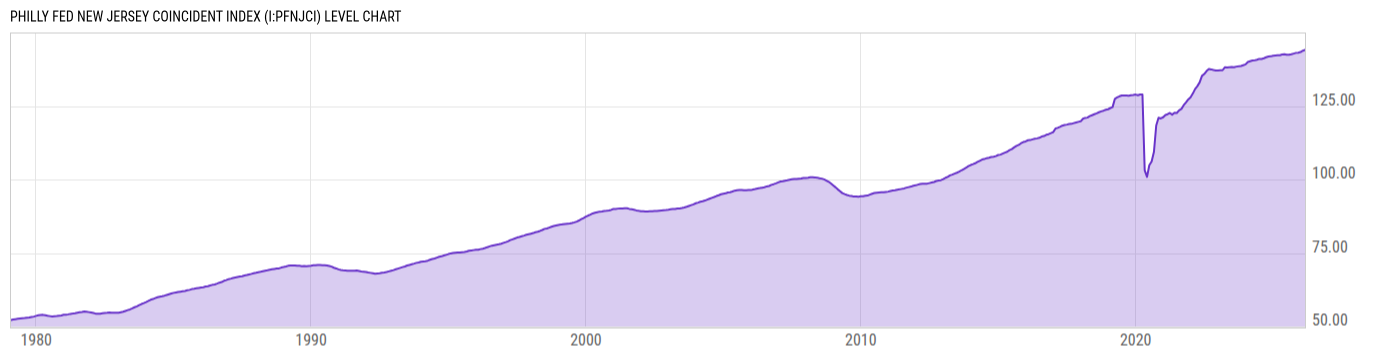
Level Chart
Basic Info
|
Philly Fed New Jersey Coincident Index is at a current level of 144.11, up from 143.81 last month and up from 142.22 one year ago. This is a change of 0.21% from last month and 1.32% from one year ago. |
| Report | Philly Fed Coincident Index |
| Category | Economic Sentiment, Outlook and Activity |
| Region | New Jersey |
| Source | Federal Reserve Bank of Philadelphia |
Stats
| Last Value | 144.11 |
| Latest Period | Feb 2026 |
| Last Updated | Apr 28 2026, 10:05 EDT |
| Next Release | May 29 2026, 10:00 EDT |
| Average Growth Rate | 2.22% |
| Value from Last Month | 143.81 |
| Change from Last Month | 0.21% |
| Value from 1 Year Ago | 142.22 |
| Change from 1 Year Ago | 1.32% |
| Frequency | Monthly |
| Unit | Index 2007=100 |
| Adjustment | N/A |
| Download Source File | |
| Notes | Combines state-level nonfarm payroll employment, average hours worked in manufacturing, unemployment rate, and deflated (by CPI, US City average) wage and salary disbursements into one indicator of state economic conditions. |
Historical Data
| Date | Value |
|---|---|
| February 28, 2026 | 144.11 |
| January 31, 2026 | 143.81 |
| December 31, 2025 | 143.34 |
| November 30, 2025 | 143.13 |
| October 31, 2025 | 143.07 |
| September 30, 2025 | 142.83 |
| August 31, 2025 | 142.58 |
| July 31, 2025 | 142.41 |
| June 30, 2025 | 142.40 |
| May 31, 2025 | 142.62 |
| April 30, 2025 | 142.49 |
| March 31, 2025 | 142.26 |
| February 28, 2025 | 142.22 |
| January 31, 2025 | 142.16 |
| December 31, 2024 | 142.11 |
| November 30, 2024 | 141.88 |
| October 31, 2024 | 141.82 |
| September 30, 2024 | 141.58 |
| August 31, 2024 | 141.25 |
| July 31, 2024 | 141.01 |
| June 30, 2024 | 141.02 |
| May 31, 2024 | 140.74 |
| April 30, 2024 | 140.52 |
| March 31, 2024 | 140.47 |
| February 29, 2024 | 140.22 |
| Date | Value |
|---|---|
| January 31, 2024 | 139.96 |
| December 31, 2023 | 139.14 |
| November 30, 2023 | 138.87 |
| October 31, 2023 | 138.61 |
| September 30, 2023 | 138.48 |
| August 31, 2023 | 138.39 |
| July 31, 2023 | 138.16 |
| June 30, 2023 | 138.23 |
| May 31, 2023 | 138.18 |
| April 30, 2023 | 138.07 |
| March 31, 2023 | 138.17 |
| February 28, 2023 | 137.16 |
| January 31, 2023 | 137.15 |
| December 31, 2022 | 137.09 |
| November 30, 2022 | 137.10 |
| October 31, 2022 | 137.25 |
| September 30, 2022 | 137.45 |
| August 31, 2022 | 137.59 |
| July 31, 2022 | 136.88 |
| June 30, 2022 | 135.88 |
| May 31, 2022 | 135.25 |
| April 30, 2022 | 133.03 |
| March 31, 2022 | 131.76 |
| February 28, 2022 | 130.73 |
| January 31, 2022 | 129.31 |
News
Headline
Time (ET)
04/29 16:52
04/29 15:59
Basic Info
|
Philly Fed New Jersey Coincident Index is at a current level of 144.11, up from 143.81 last month and up from 142.22 one year ago. This is a change of 0.21% from last month and 1.32% from one year ago. |
| Report | Philly Fed Coincident Index |
| Category | Economic Sentiment, Outlook and Activity |
| Region | New Jersey |
| Source | Federal Reserve Bank of Philadelphia |
Stats
| Last Value | 144.11 |
| Latest Period | Feb 2026 |
| Last Updated | Apr 28 2026, 10:05 EDT |
| Next Release | May 29 2026, 10:00 EDT |
| Average Growth Rate | 2.22% |
| Value from Last Month | 143.81 |
| Change from Last Month | 0.21% |
| Value from 1 Year Ago | 142.22 |
| Change from 1 Year Ago | 1.32% |
| Frequency | Monthly |
| Unit | Index 2007=100 |
| Adjustment | N/A |
| Download Source File | |
| Notes | Combines state-level nonfarm payroll employment, average hours worked in manufacturing, unemployment rate, and deflated (by CPI, US City average) wage and salary disbursements into one indicator of state economic conditions. |