

Philly Fed Delaware Coincident Index (I:PFDCI)
140.25 for Feb 2026
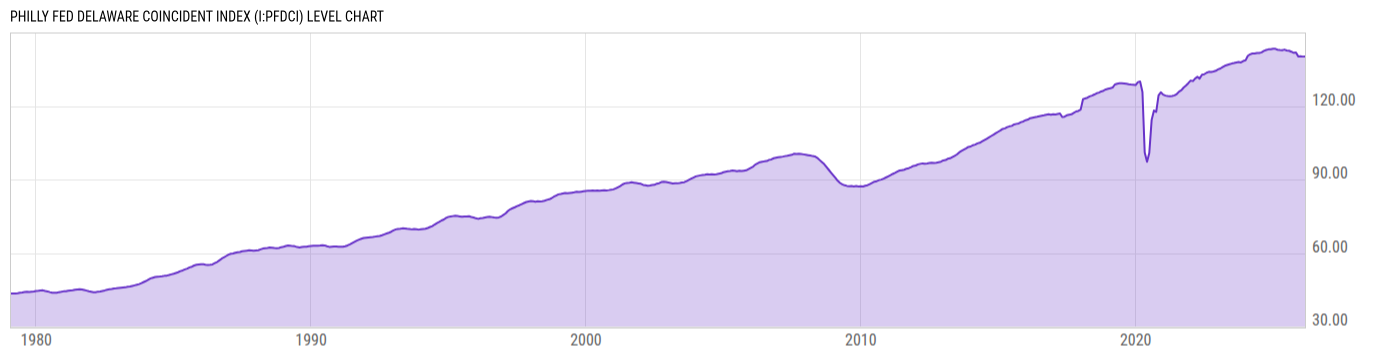
Level Chart
Basic Info
|
Philly Fed Delaware Coincident Index is at a current level of 140.25, up from 140.15 last month and down from 142.96 one year ago. This is a change of 0.07% from last month and -1.90% from one year ago. |
| Report | Philly Fed Coincident Index |
| Category | Economic Sentiment, Outlook and Activity |
| Region | Delaware |
| Source | Federal Reserve Bank of Philadelphia |
Stats
| Last Value | 140.25 |
| Latest Period | Feb 2026 |
| Last Updated | Apr 28 2026, 10:05 EDT |
| Next Release | May 29 2026, 10:00 EDT |
| Average Growth Rate | 2.57% |
| Value from Last Month | 140.15 |
| Change from Last Month | 0.07% |
| Value from 1 Year Ago | 142.96 |
| Change from 1 Year Ago | -1.90% |
| Frequency | Monthly |
| Unit | Index 2007=100 |
| Adjustment | N/A |
| Download Source File | |
| Notes | Combines state-level nonfarm payroll employment, average hours worked in manufacturing, unemployment rate, and deflated (by CPI, US City average) wage and salary disbursements into one indicator of state economic conditions. |
Historical Data
| Date | Value |
|---|---|
| February 28, 2026 | 140.24 |
| January 31, 2026 | 140.15 |
| December 31, 2025 | 140.28 |
| November 30, 2025 | 140.25 |
| October 31, 2025 | 141.79 |
| September 30, 2025 | 141.69 |
| August 31, 2025 | 142.15 |
| July 31, 2025 | 142.54 |
| June 30, 2025 | 142.67 |
| May 31, 2025 | 143.02 |
| April 30, 2025 | 142.79 |
| March 31, 2025 | 142.84 |
| February 28, 2025 | 142.96 |
| January 31, 2025 | 143.33 |
| December 31, 2024 | 143.35 |
| November 30, 2024 | 143.14 |
| October 31, 2024 | 143.12 |
| September 30, 2024 | 142.84 |
| August 31, 2024 | 142.47 |
| July 31, 2024 | 141.88 |
| June 30, 2024 | 141.65 |
| May 31, 2024 | 141.66 |
| April 30, 2024 | 141.43 |
| March 31, 2024 | 141.43 |
| February 29, 2024 | 141.06 |
| Date | Value |
|---|---|
| January 31, 2024 | 140.52 |
| December 31, 2023 | 138.64 |
| November 30, 2023 | 138.35 |
| October 31, 2023 | 137.78 |
| September 30, 2023 | 137.96 |
| August 31, 2023 | 137.77 |
| July 31, 2023 | 137.53 |
| June 30, 2023 | 137.31 |
| May 31, 2023 | 137.03 |
| April 30, 2023 | 136.72 |
| March 31, 2023 | 136.42 |
| February 28, 2023 | 135.84 |
| January 31, 2023 | 135.31 |
| December 31, 2022 | 134.93 |
| November 30, 2022 | 134.36 |
| October 31, 2022 | 134.07 |
| September 30, 2022 | 133.88 |
| August 31, 2022 | 133.93 |
| July 31, 2022 | 133.59 |
| June 30, 2022 | 132.94 |
| May 31, 2022 | 132.78 |
| April 30, 2022 | 131.19 |
| March 31, 2022 | 131.88 |
| February 28, 2022 | 131.18 |
| January 31, 2022 | 130.18 |
News
Headline
Time (ET)
04/29 16:52
04/29 15:59
Basic Info
|
Philly Fed Delaware Coincident Index is at a current level of 140.25, up from 140.15 last month and down from 142.96 one year ago. This is a change of 0.07% from last month and -1.90% from one year ago. |
| Report | Philly Fed Coincident Index |
| Category | Economic Sentiment, Outlook and Activity |
| Region | Delaware |
| Source | Federal Reserve Bank of Philadelphia |
Stats
| Last Value | 140.25 |
| Latest Period | Feb 2026 |
| Last Updated | Apr 28 2026, 10:05 EDT |
| Next Release | May 29 2026, 10:00 EDT |
| Average Growth Rate | 2.57% |
| Value from Last Month | 140.15 |
| Change from Last Month | 0.07% |
| Value from 1 Year Ago | 142.96 |
| Change from 1 Year Ago | -1.90% |
| Frequency | Monthly |
| Unit | Index 2007=100 |
| Adjustment | N/A |
| Download Source File | |
| Notes | Combines state-level nonfarm payroll employment, average hours worked in manufacturing, unemployment rate, and deflated (by CPI, US City average) wage and salary disbursements into one indicator of state economic conditions. |