

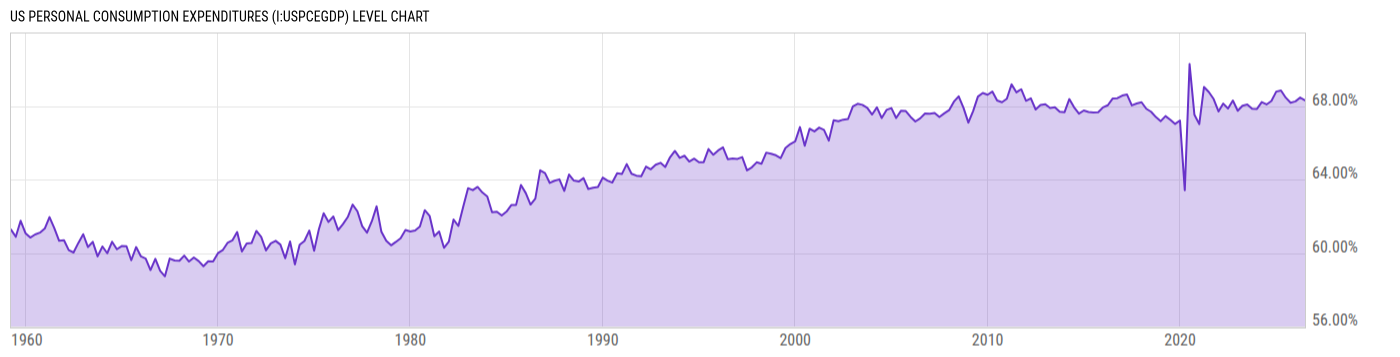
US Personal Consumption Expenditures (I:USPCEGDP)
68.31% of GDP for Jun 2026
Level Chart
Basic Info
|
US Personal Consumption Expenditures is at 68.31%, compared to 68.46% last month and 68.45% last year. This is higher than the long term average of 64.42%. |
| Report | Personal Income and Outlays |
| Category | Consumer & Household Statistics |
| Region | United States |
| Source | Bureau of Economic Analysis |
Stats
| Last Value | 68.31% |
| Latest Period | Jun 2026 |
| Last Updated | Jul 30 2026, 08:31 EDT |
| Long Term Average | 64.42% |
| Average Growth Rate | 0.56% |
| Value from Last Month | 68.46% |
| Change from Last Month | -0.22% |
| Value from 1 Year Ago | 68.45% |
| Change from 1 Year Ago | -0.21% |
| Frequency | Monthly |
| Unit | Percent of GDP |
| Adjustment | Not Seasonally Adjusted |
| Notes | Personal consumption as a percent of GDP. |
| Formula | US Personal Consumption Expenditures * 100.00 / US GDP |
Historical Data
| Date | Value |
|---|---|
| June 30, 2026 | 68.31% |
| March 31, 2026 | 68.46% |
| December 31, 2025 | 68.25% |
| September 30, 2025 | 68.18% |
| June 30, 2025 | 68.45% |
| March 31, 2025 | 68.85% |
| December 31, 2024 | 68.78% |
| September 30, 2024 | 68.27% |
| June 30, 2024 | 68.08% |
| March 31, 2024 | 68.21% |
| December 31, 2023 | 67.84% |
| September 30, 2023 | 67.85% |
| June 30, 2023 | 68.08% |
| March 31, 2023 | 68.02% |
| December 31, 2022 | 67.74% |
| September 30, 2022 | 68.30% |
| June 30, 2022 | 67.86% |
| March 31, 2022 | 68.13% |
| December 31, 2021 | 67.70% |
| September 30, 2021 | 68.38% |
| June 30, 2021 | 68.76% |
| March 31, 2021 | 69.03% |
| December 31, 2020 | 67.02% |
| September 30, 2020 | 67.52% |
| June 30, 2020 | 70.28% |
| Date | Value |
|---|---|
| March 31, 2020 | 63.41% |
| December 31, 2019 | 67.21% |
| September 30, 2019 | 67.02% |
| June 30, 2019 | 67.26% |
| March 31, 2019 | 67.45% |
| December 31, 2018 | 67.18% |
| September 30, 2018 | 67.40% |
| June 30, 2018 | 67.69% |
| March 31, 2018 | 67.85% |
| December 31, 2017 | 68.20% |
| September 30, 2017 | 68.13% |
| June 30, 2017 | 68.04% |
| March 31, 2017 | 68.62% |
| December 31, 2016 | 68.57% |
| September 30, 2016 | 68.42% |
| June 30, 2016 | 68.40% |
| March 31, 2016 | 68.04% |
| December 31, 2015 | 67.92% |
| September 30, 2015 | 67.66% |
| June 30, 2015 | 67.65% |
| March 31, 2015 | 67.68% |
| December 31, 2014 | 67.76% |
| September 30, 2014 | 67.58% |
| June 30, 2014 | 67.93% |
| March 31, 2014 | 68.37% |
News
Headline
Time (ET)
07/31 13:23
07/31 08:52
07/13 16:25
Basic Info
|
US Personal Consumption Expenditures is at 68.31%, compared to 68.46% last month and 68.45% last year. This is higher than the long term average of 64.42%. |
| Report | Personal Income and Outlays |
| Category | Consumer & Household Statistics |
| Region | United States |
| Source | Bureau of Economic Analysis |
Stats
| Last Value | 68.31% |
| Latest Period | Jun 2026 |
| Last Updated | Jul 30 2026, 08:31 EDT |
| Long Term Average | 64.42% |
| Average Growth Rate | 0.56% |
| Value from Last Month | 68.46% |
| Change from Last Month | -0.22% |
| Value from 1 Year Ago | 68.45% |
| Change from 1 Year Ago | -0.21% |
| Frequency | Monthly |
| Unit | Percent of GDP |
| Adjustment | Not Seasonally Adjusted |
| Notes | Personal consumption as a percent of GDP. |
| Formula | US Personal Consumption Expenditures * 100.00 / US GDP |