

Pennsylvania Coronavirus Tests Administered (I:PCTA)
31.08M for Jul 26 2023
Level Chart
Basic Info
|
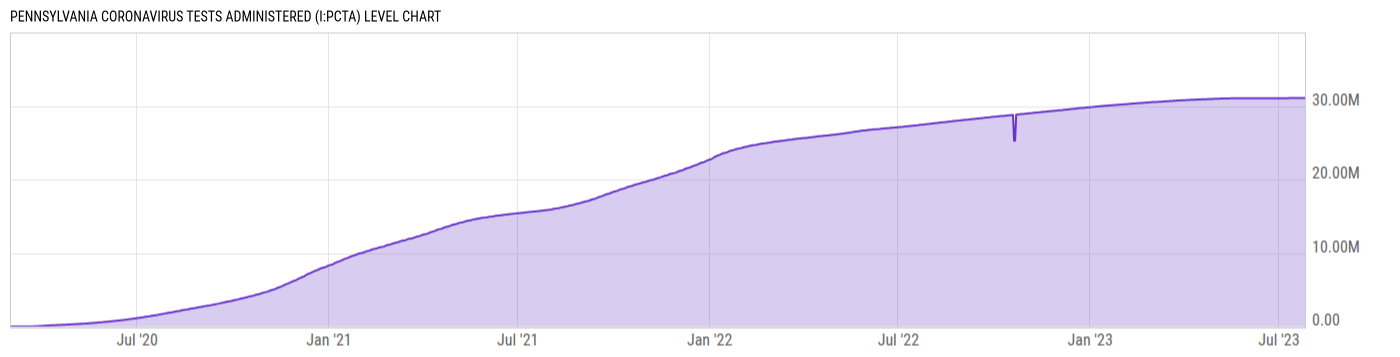
Pennsylvania Coronavirus Tests Administered is at a current level of 31.08M, up from 31.08M yesterday and up from 27.49M one year ago. This is a change of 0.00% from yesterday and 13.03% from one year ago. |
| Report | US COVID-19 Diagnostic Laboratory Testing by State |
| Category | Public Health |
| Region | Pennsylvania |
| Source | US Department of Health & Human Services |
Stats
| Last Value | 31.08M |
| Latest Period | Jul 26 2023 |
| Last Updated | Jul 29 2023, 12:03 EDT |
| Next Release | May 22 2026, 18:00 EDT (E) |
| Average Growth Rate | 507.5% |
| Value from Yesterday | 31.08M |
| Change from Yesterday | 0.00% |
| Value from 1 Year Ago | 27.49M |
| Change from 1 Year Ago | 13.03% |
| Frequency | Daily |
| Adjustment | N/A |
| Download Source File |
Historical Data
| Date | Value |
|---|---|
| July 26, 2023 | 31.08M |
| July 25, 2023 | 31.08M |
| July 24, 2023 | 31.08M |
| July 23, 2023 | 31.08M |
| July 22, 2023 | 31.08M |
| July 21, 2023 | 31.07M |
| July 20, 2023 | 31.07M |
| July 19, 2023 | 31.07M |
| July 18, 2023 | 31.07M |
| July 17, 2023 | 31.07M |
| July 16, 2023 | 31.07M |
| July 15, 2023 | 31.07M |
| July 14, 2023 | 31.07M |
| July 13, 2023 | 31.07M |
| July 12, 2023 | 31.07M |
| July 11, 2023 | 31.07M |
| July 10, 2023 | 31.07M |
| July 09, 2023 | 31.07M |
| July 08, 2023 | 31.07M |
| July 07, 2023 | 31.07M |
| July 06, 2023 | 31.07M |
| July 05, 2023 | 31.07M |
| July 04, 2023 | 31.07M |
| July 03, 2023 | 31.07M |
| July 02, 2023 | 31.07M |
| Date | Value |
|---|---|
| July 01, 2023 | 31.07M |
| June 30, 2023 | 31.07M |
| June 29, 2023 | 31.07M |
| June 28, 2023 | 31.07M |
| June 27, 2023 | 31.07M |
| June 26, 2023 | 31.07M |
| June 25, 2023 | 31.07M |
| June 24, 2023 | 31.07M |
| June 23, 2023 | 31.07M |
| June 22, 2023 | 31.07M |
| June 21, 2023 | 31.06M |
| June 20, 2023 | 31.06M |
| June 19, 2023 | 31.06M |
| June 18, 2023 | 31.06M |
| June 17, 2023 | 31.06M |
| June 16, 2023 | 31.06M |
| June 15, 2023 | 31.06M |
| June 14, 2023 | 31.06M |
| June 13, 2023 | 31.06M |
| June 12, 2023 | 31.06M |
| June 11, 2023 | 31.06M |
| June 10, 2023 | 31.06M |
| June 09, 2023 | 31.06M |
| June 08, 2023 | 31.06M |
| June 07, 2023 | 31.06M |
News
Headline
Time (ET)
05/13 06:50
Basic Info
|
Pennsylvania Coronavirus Tests Administered is at a current level of 31.08M, up from 31.08M yesterday and up from 27.49M one year ago. This is a change of 0.00% from yesterday and 13.03% from one year ago. |
| Report | US COVID-19 Diagnostic Laboratory Testing by State |
| Category | Public Health |
| Region | Pennsylvania |
| Source | US Department of Health & Human Services |
Stats
| Last Value | 31.08M |
| Latest Period | Jul 26 2023 |
| Last Updated | Jul 29 2023, 12:03 EDT |
| Next Release | May 22 2026, 18:00 EDT (E) |
| Average Growth Rate | 507.5% |
| Value from Yesterday | 31.08M |
| Change from Yesterday | 0.00% |
| Value from 1 Year Ago | 27.49M |
| Change from 1 Year Ago | 13.03% |
| Frequency | Daily |
| Adjustment | N/A |
| Download Source File |
Related Indicators
| Pennsylvania Coronavirus Stats |