

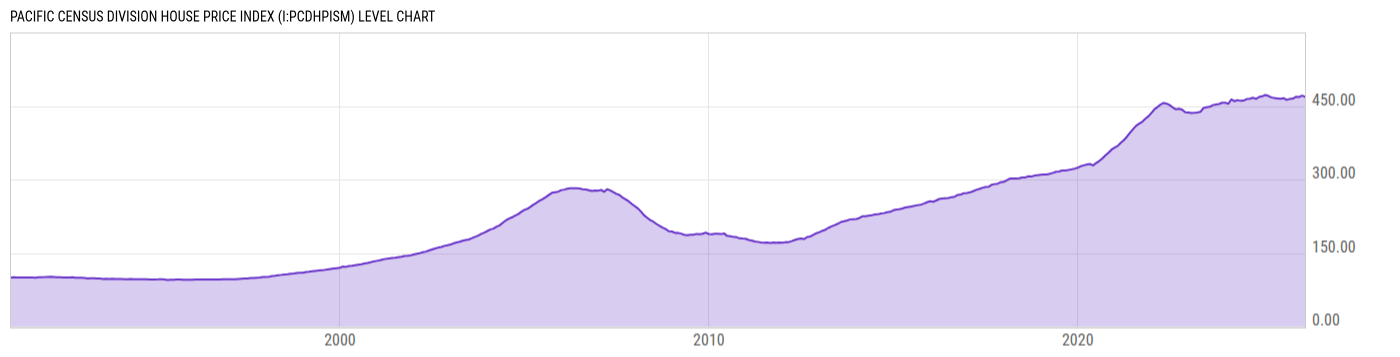
Pacific Census Division House Price Index (I:PCDHPISM)
467.66 for Mar 2026
Level Chart
Basic Info
|
Pacific Census Division House Price Index is at a current level of 467.66, down from 469.34 last month and up from 467.53 one year ago. This is a change of -0.36% from last month and 0.03% from one year ago. |
| Report | FHFA House Price Index |
| Category | House Prices |
| Region | United States |
| Source | Federal Housing Finance Agency |
Stats
| Last Value | 467.66 |
| Latest Period | Mar 2026 |
| Last Updated | May 26 2026, 09:02 EDT |
| Next Release | Jun 30 2026, 09:00 EDT |
| Average Growth Rate | 4.44% |
| Value from Last Month | 469.34 |
| Change from Last Month | -0.36% |
| Value from 1 Year Ago | 467.53 |
| Change from 1 Year Ago | 0.03% |
| Frequency | Monthly |
| Unit | Index January 1991=100 |
| Adjustment | Seasonally Adjusted |
| Download Source File |
Historical Data
| Date | Value |
|---|---|
| March 31, 2026 | 467.66 |
| February 28, 2026 | 469.34 |
| January 31, 2026 | 471.28 |
| December 31, 2025 | 468.71 |
| November 30, 2025 | 468.60 |
| October 31, 2025 | 465.19 |
| September 30, 2025 | 464.31 |
| August 31, 2025 | 462.31 |
| July 31, 2025 | 465.72 |
| June 30, 2025 | 464.06 |
| May 31, 2025 | 464.96 |
| April 30, 2025 | 465.53 |
| March 31, 2025 | 467.53 |
| February 28, 2025 | 470.11 |
| January 31, 2025 | 471.83 |
| December 31, 2024 | 469.47 |
| November 30, 2024 | 468.12 |
| October 31, 2024 | 464.69 |
| September 30, 2024 | 466.34 |
| August 31, 2024 | 464.85 |
| July 31, 2024 | 463.87 |
| June 30, 2024 | 461.01 |
| May 31, 2024 | 460.00 |
| April 30, 2024 | 461.73 |
| March 31, 2024 | 459.67 |
| Date | Value |
|---|---|
| February 29, 2024 | 463.33 |
| January 31, 2024 | 454.55 |
| December 31, 2023 | 456.75 |
| November 30, 2023 | 456.59 |
| October 31, 2023 | 454.02 |
| September 30, 2023 | 452.90 |
| August 31, 2023 | 451.80 |
| July 31, 2023 | 448.35 |
| June 30, 2023 | 447.50 |
| May 31, 2023 | 445.97 |
| April 30, 2023 | 438.15 |
| March 31, 2023 | 436.87 |
| February 28, 2023 | 436.15 |
| January 31, 2023 | 435.78 |
| December 31, 2022 | 436.80 |
| November 30, 2022 | 437.10 |
| October 31, 2022 | 442.45 |
| September 30, 2022 | 444.49 |
| August 31, 2022 | 443.16 |
| July 31, 2022 | 446.88 |
| June 30, 2022 | 451.76 |
| May 31, 2022 | 454.79 |
| April 30, 2022 | 456.30 |
| March 31, 2022 | 453.04 |
| February 28, 2022 | 447.76 |
News
Headline
Time (ET)
06/03 07:13
05/28 12:00
05/15 07:05
05/14 12:00
05/14 07:24
05/07 12:00
Basic Info
|
Pacific Census Division House Price Index is at a current level of 467.66, down from 469.34 last month and up from 467.53 one year ago. This is a change of -0.36% from last month and 0.03% from one year ago. |
| Report | FHFA House Price Index |
| Category | House Prices |
| Region | United States |
| Source | Federal Housing Finance Agency |
Stats
| Last Value | 467.66 |
| Latest Period | Mar 2026 |
| Last Updated | May 26 2026, 09:02 EDT |
| Next Release | Jun 30 2026, 09:00 EDT |
| Average Growth Rate | 4.44% |
| Value from Last Month | 469.34 |
| Change from Last Month | -0.36% |
| Value from 1 Year Ago | 467.53 |
| Change from 1 Year Ago | 0.03% |
| Frequency | Monthly |
| Unit | Index January 1991=100 |
| Adjustment | Seasonally Adjusted |
| Download Source File |