

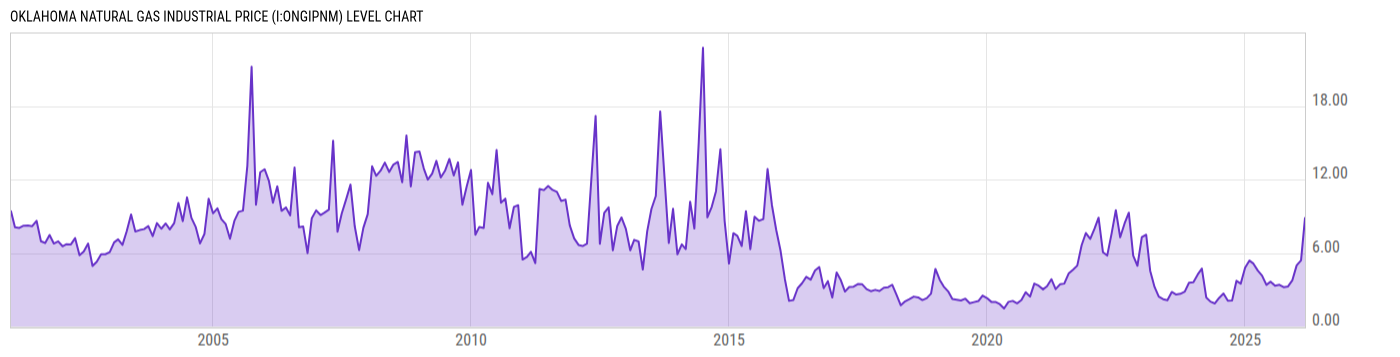
Oklahoma Natural Gas Industrial Price (I:ONGIPNM)
8.85 USD/thou cf for Feb 2026
Level Chart
Basic Info
|
Oklahoma Natural Gas Industrial Price is at a current level of 8.85, up from 5.40 last month and up from 5.13 one year ago. This is a change of 63.89% from last month and 72.51% from one year ago. |
| Report | Natural Gas Monthly |
| Category | Energy |
| Region | Oklahoma |
| Source | Energy Information Administration |
Stats
| Last Value | 8.85 |
| Latest Period | Feb 2026 |
| Last Updated | May 3 2026, 18:17 EDT |
| Next Release | May 29 2026, 10:30 EDT |
| Average Growth Rate | 36.67% |
| Value from Last Month | 5.40 |
| Change from Last Month | 63.89% |
| Value from 1 Year Ago | 5.13 |
| Change from 1 Year Ago | 72.51% |
| Frequency | Monthly |
| Unit | USD per Thousand Cubic Feet |
| Adjustment | N/A |
| Download Source File |
Historical Data
| Date | Value |
|---|---|
| February 28, 2026 | 8.85 |
| January 31, 2026 | 5.40 |
| December 31, 2025 | 4.99 |
| November 30, 2025 | 3.76 |
| October 31, 2025 | 3.27 |
| September 30, 2025 | 3.21 |
| August 31, 2025 | 3.40 |
| July 31, 2025 | 3.32 |
| June 30, 2025 | 3.66 |
| May 31, 2025 | 3.40 |
| April 30, 2025 | 4.15 |
| March 31, 2025 | 4.56 |
| February 28, 2025 | 5.13 |
| January 31, 2025 | 5.38 |
| December 31, 2024 | 4.79 |
| November 30, 2024 | 3.50 |
| October 31, 2024 | 3.73 |
| September 30, 2024 | 2.13 |
| August 31, 2024 | 2.11 |
| July 31, 2024 | 2.69 |
| June 30, 2024 | 2.33 |
| May 31, 2024 | 1.88 |
| April 30, 2024 | 2.03 |
| March 31, 2024 | 2.37 |
| February 29, 2024 | 4.73 |
| Date | Value |
|---|---|
| January 31, 2024 | 4.25 |
| December 31, 2023 | 3.61 |
| November 30, 2023 | 3.57 |
| October 31, 2023 | 2.85 |
| September 30, 2023 | 2.67 |
| August 31, 2023 | 2.61 |
| July 31, 2023 | 2.82 |
| June 30, 2023 | 2.14 |
| May 31, 2023 | 2.23 |
| April 30, 2023 | 2.44 |
| March 31, 2023 | 3.23 |
| February 28, 2023 | 4.56 |
| January 31, 2023 | 7.49 |
| December 31, 2022 | 7.30 |
| November 30, 2022 | 4.96 |
| October 31, 2022 | 5.78 |
| September 30, 2022 | 9.29 |
| August 31, 2022 | 8.41 |
| July 31, 2022 | 7.28 |
| June 30, 2022 | 9.49 |
| May 31, 2022 | 7.58 |
| April 30, 2022 | 5.79 |
| March 31, 2022 | 6.06 |
| February 28, 2022 | 8.88 |
| January 31, 2022 | 8.01 |
News
Headline
Time (ET)
05/15 06:06
05/07 09:33
04/30 09:31
04/28 09:25
Basic Info
|
Oklahoma Natural Gas Industrial Price is at a current level of 8.85, up from 5.40 last month and up from 5.13 one year ago. This is a change of 63.89% from last month and 72.51% from one year ago. |
| Report | Natural Gas Monthly |
| Category | Energy |
| Region | Oklahoma |
| Source | Energy Information Administration |
Stats
| Last Value | 8.85 |
| Latest Period | Feb 2026 |
| Last Updated | May 3 2026, 18:17 EDT |
| Next Release | May 29 2026, 10:30 EDT |
| Average Growth Rate | 36.67% |
| Value from Last Month | 5.40 |
| Change from Last Month | 63.89% |
| Value from 1 Year Ago | 5.13 |
| Change from 1 Year Ago | 72.51% |
| Frequency | Monthly |
| Unit | USD per Thousand Cubic Feet |
| Adjustment | N/A |
| Download Source File |